Cybercrime is more costly than ever. Companies lose billions of dollars every year due to cybercrime losses, prevention, and recovery. That’s why cybersecurity is one of the most important topics for organizations.
In this article, we’ve put together a list of the latest cybersecurity statistics from the most trusted publications available. The cybersecurity topics we’ve covered include the following:
The cost of cybercrime
Cybercrime by industry
Cybercrime by region
Malware
Phishing
Data breaches
And more…
Let’s delve right in.
Cybersecurity Statistics — Key Findings
The following list sums up the cybersecurity landscape in 2023.
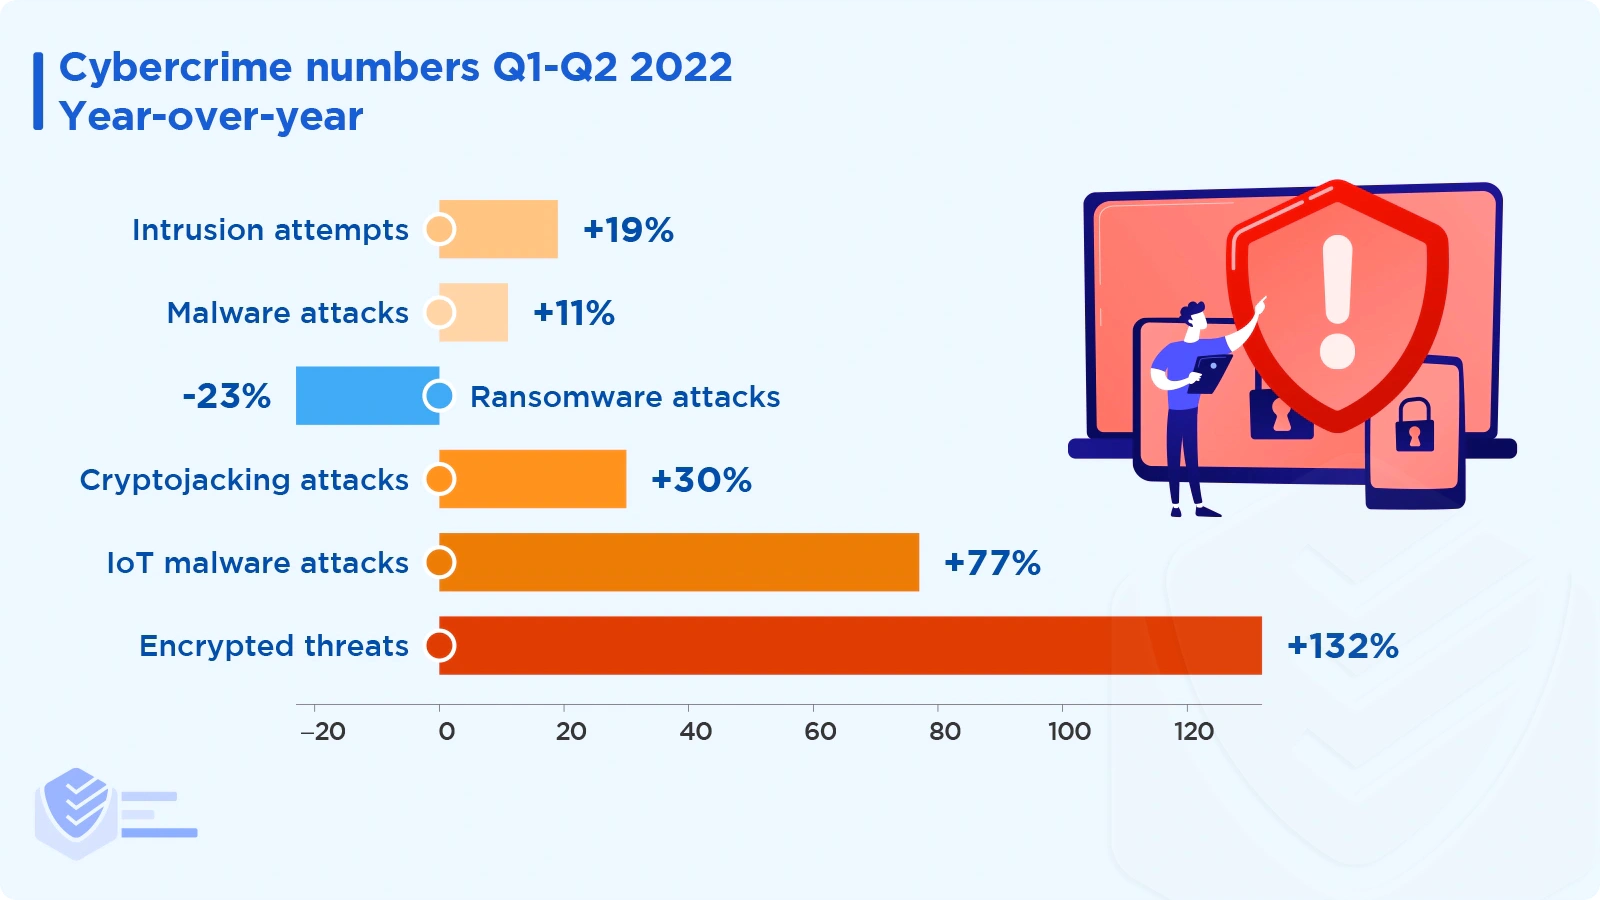
Cybercrime numbers for Q1-Q2 2022 versus the previous period:
3 trillion intrusion attempts (19% increase)
2.8 billion malware attacks (11% increase)
236.1 million ransomware attacks (23% decrease)
66.7 million cryptojacking attacks (30% increase)
57 million IoT malware attacks (77% increase)
4.9 million encrypted threats (132% increase) [SonicWall]
The number of cyberattacks rose by 57% in 2021. [Sophos]
The most prevalent type of malware in 2022 is ransomware. [Cybereason]
In 2021, there were 34% more reported phishing incidents than in 2020 and almost 13 times as many as in 2017.
Password attacks have increased 74% in just one year, to an estimated 921 attacks every second. [Microsoft]
Microsoft has taken down over 10,000 malicious domains, and 600 were used in nation-state attacks. [Microsoft]
Microsoft stopped 710 million phishing emails per week. [Microsoft]
Microsoft blocked 37 billion email threats in Q3 2021 - Q2 2022. [Microsoft]
Microsoft stopped 34.7 billion identity threats in Q3 2021 - Q2 2022. [Microsoft]
Since 2019, the number of deepfakes has increased by 900% annually. [Microsoft]
With 26% of all cyberattacks, Asia was the region most frequently attacked in 2021. Europe and North America came in second and third place with 24% and 23% of attacks, respectively. [IBM Security]
In 2021, manufacturing surpassed financial services as the industry with the highest attack rate (23.2% of attacks). Most attacks against manufacturing companies (23%) used ransomware as their primary method of attack. [IBM Security]
Top attack types detected globally — 2021 vs 2020:
Ransomware — 21% vs 23%
Server access — 14% vs 10%
Business Email Compromise (BEC) — 8% vs 9%
Data Theft — 8% vs 13%
Credential Phishing — 7% vs 6%
RAT — 5% vs 6%
Misconfiguration — 5% vs 5%
Malicious insider — 5% vs 5%
Other — 27% vs 23% [IBM Security]
The top infection vectors in 2021:
The top threat actors in 2021:
In 2021, the American public sent the Internet Crime Complaint Center (IC3) a record number of complaints, 847,376, a 7% increase from 2020. The estimated losses are greater than $6.9 billion. [FBI]
Between 2016 and 2020, IC3 received, on average, 552,000 complaints annually (or 2,300 daily). [FBI]
The top five cybercrimes in the US — 2021 vs 2020:
Phishing/Vishing/Smishing/Pharming — 324K vs 241K
Non-Payment / Non-Delivery — 82K vs 109K
Personal Data Breach — 52K vs 45K
Identity Theft — 52K vs 43K
Extortion — 39K vs 77K [FBI]
The top five US states with the most victims of cybercrime are California (67K), Florida (46K), Texas (41K), New York (29K), and Illinois (18K).
Here are the US states with the most losses per victim in 2021:
Cybercrime Costs
The cost of cybercrime is enormous and continues to increase. Here are several eye-opening facts.
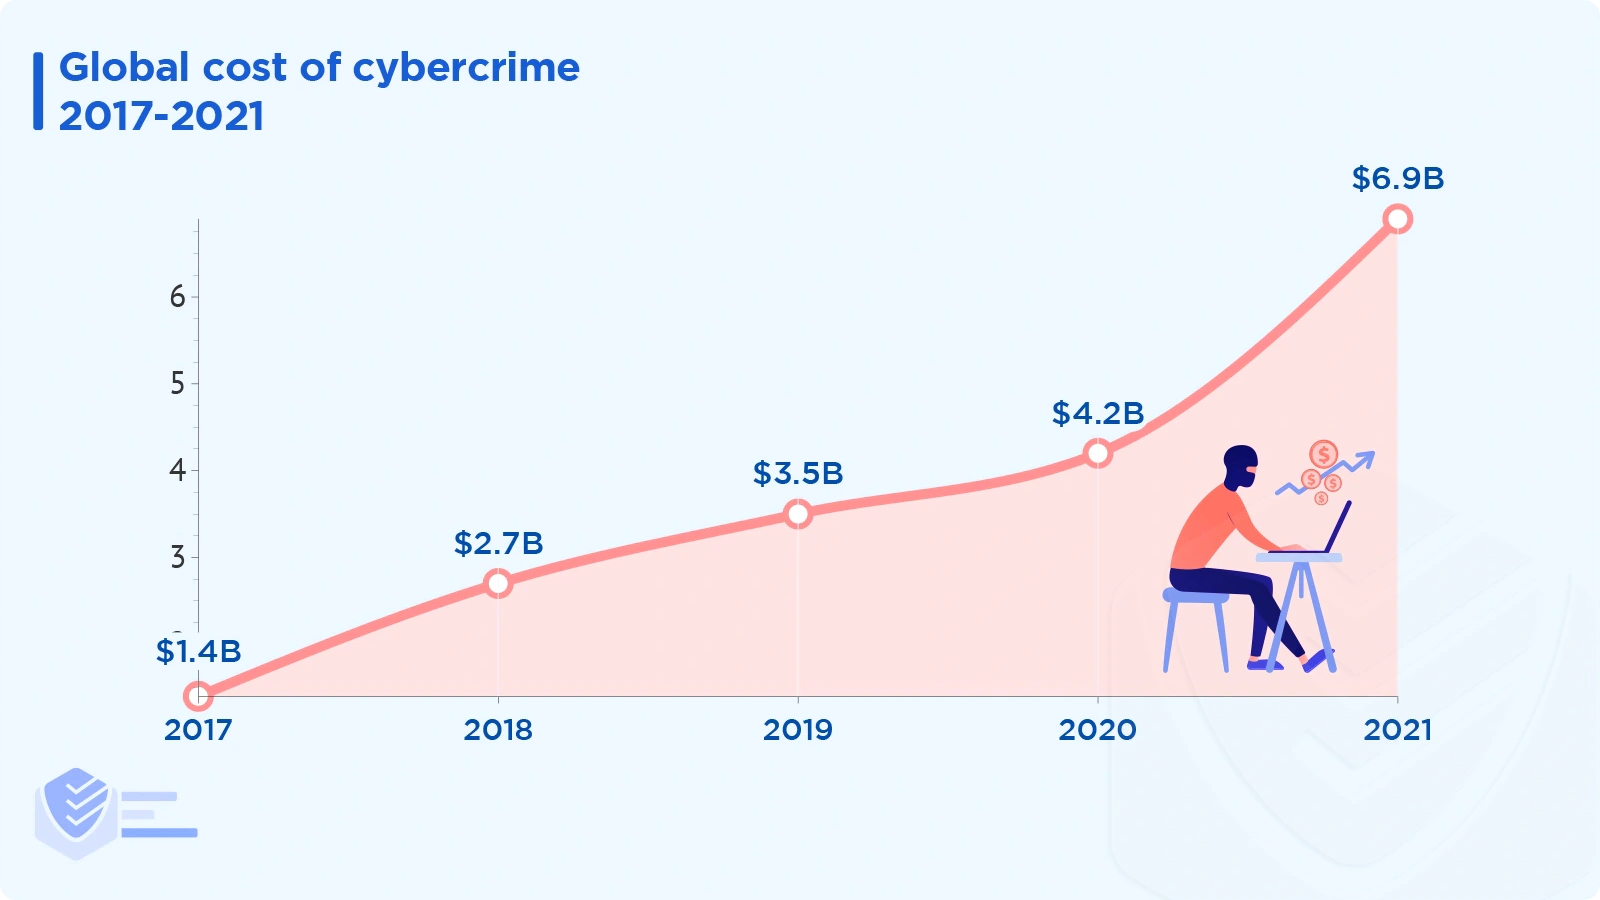
This is how many complaints and losses IC3 received between 2017 and 2021:
2021: 847K complaints; $6.9 billion in losses
2020: 792K complaints; $4.2 billion in losses
2019: 467K complaints; $3.5 billion in losses
2018: 352K complaints; $2.7 billion in losses
2017: 306K complaints; $1.4 billion in losses [FBI]
Ad fraud costs the global digital advertising sector $51 million every day. [Bloomberg Law]
Over the next five years, the cost of cybercrime will increase by 15% annually, reaching $10.5 trillion in 2025 from $3 trillion in 2015. [Cybersecurity Ventures]
Australia's economy suffers a $42 billion annual loss due to cybercrime. [UNSW Canberra]
In 2021, the FBI managed to freeze 74% of the funds involved in 1726 cybersecurity incidents. More specifically, $328 million were frozen, and $115 million were lost. [FBI]
Victims by age group in the US (complaints and losses):
60+ — 92K complaints; $1.69 billion losses
50-59 — 74K complaints; $1.26 billion losses
40-49 — 89K complaints; $1.19 billion losses
30-39 — 88K complaints; $937 million losses
20-29 — 69K complaints; $431 million losses
Under 20 — 15K complaints; $101 million losses [FBI]
The most common crime types (by victim loss) in the US:
BEC — $2,395 billion
Investment — $1,455 billion
Confidence fraud / Romance — $956 million
Personal data breach — $517 million
Real estate / Rental — $350 million
Tech support — $347 million
Non-payment / Non-delivery — $337 million
Identity theft — $278 million
Credit card fraud — $172 million
Corporate data breach — $151 million [FBI]
The total victim losses in the US by state:
California — $1,228 billion
Texas — $606 million
New York — $560 million
Florida — $529 million
Pennsylvania — $207 million
New Jersey — $204 million
Illinois — $185 million
Michigan — $182 million
Virginia — $173 million
Washington — $157 million [FBI]
Cybercrime by Industry
Cyber attackers target certain industries more frequently than others. Here’s what we know.
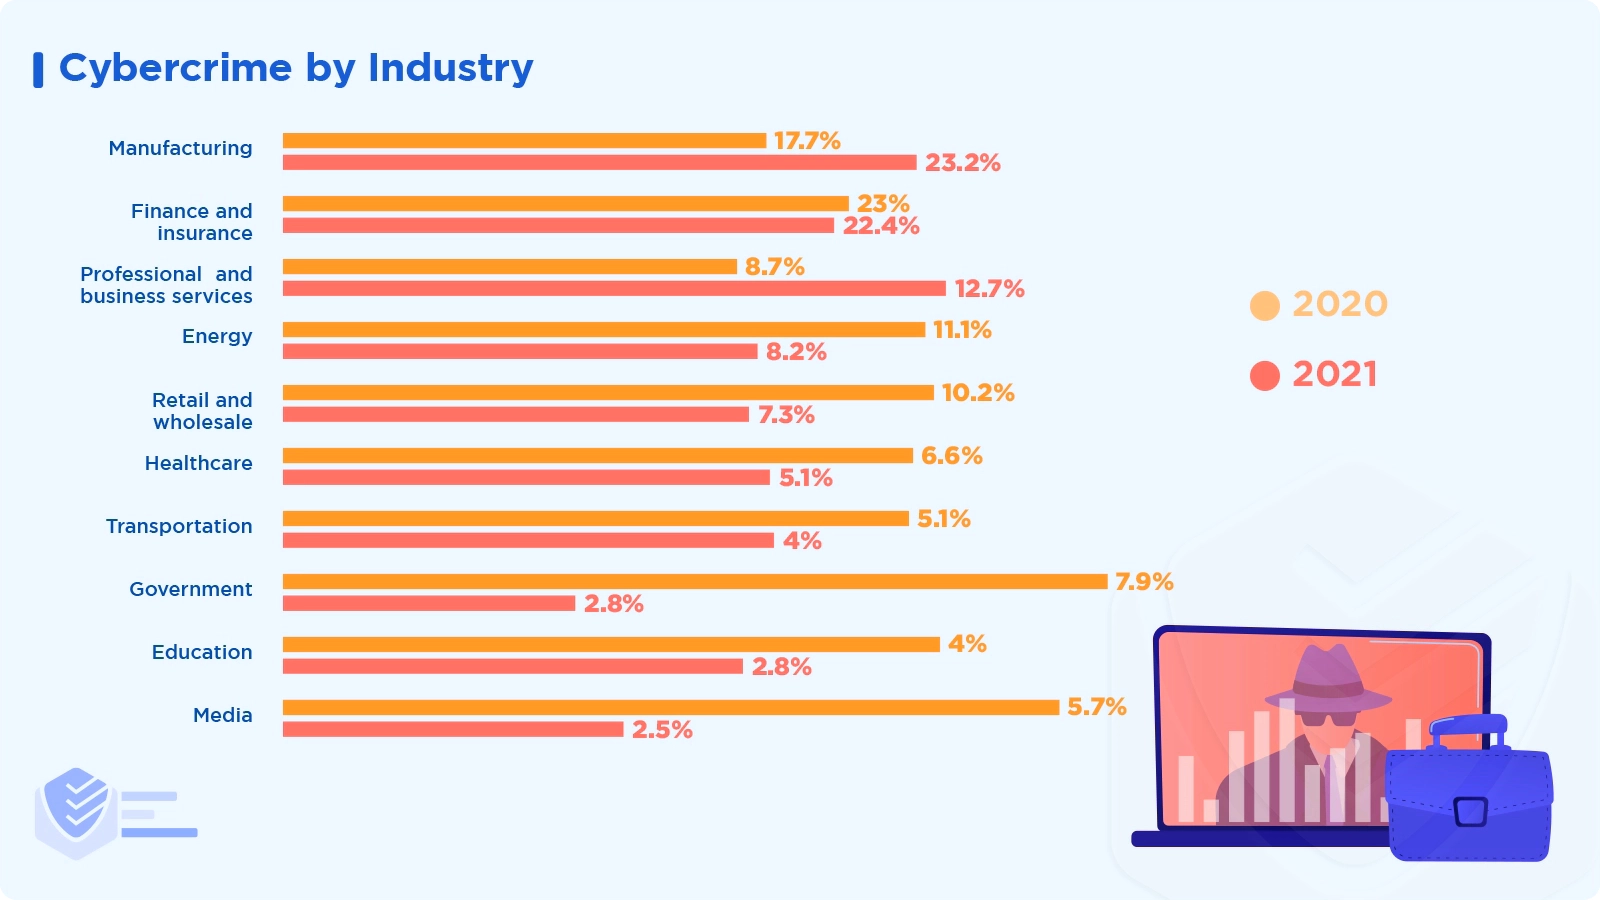
Here are the ten industries that are the most affected by cybercrime according to IBM Security (2021 vs 2020):
Manufacturing — 23.2% vs 17.7%
Finance and insurance — 22.4% vs 23%
Professional and business services — 12.7% vs 8.7%
Energy — 8.2% vs 11.1%
Retail and wholesale — 7.3% vs 10.2%
Healthcare — 5.1% vs 6.6%
Transportation — 4% vs 5.1%
Government — 2.8% vs 7.9%
Education — 2.8% vs 4%
Media — 2.5% vs 5.7% [IBM Security]
The industries that nation-state threat actors target the most include:
Here are the industries that Russian threat actors attack the most:
Information technology — 29%
Nongovernmental organizations — 18%
Government agencies and services — 12%
Education — 12%
Finance — 5%
Other — 24% [Microsoft]
The industries that Chinese threat actors targeted the most in 2021 are:
Nongovernmental organizations — 28%
Digital print and broadcast media — 17%
Information technology — 10%
Education — 9%
Government agencies and services — 9%
Other — 27% [Microsoft]
Cybercrime by Region
Learn about which regions or countries are the most affected by cyber threats.
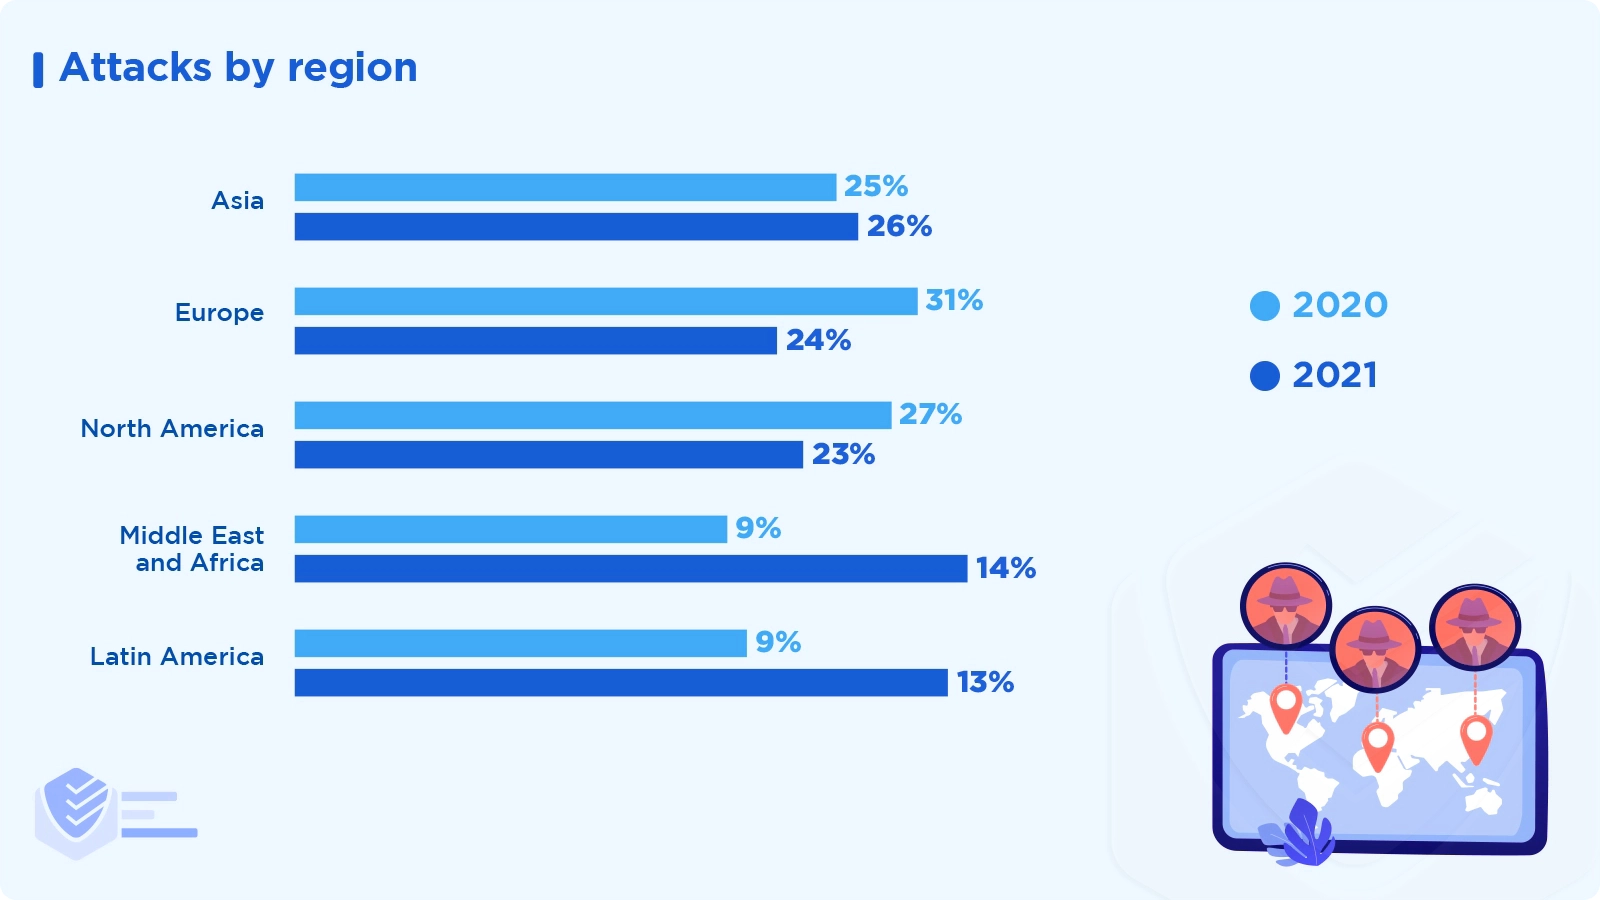
Asia was the region that experienced the most cyberattacks in 2021, accounting for 26% of all attacks. With 24% and 23% of the attacks, respectively, Europe and North America came in second and third, while the Middle East & Africa received 14% and Latin America 13% of the attacks. [IBM Security]
Here are the countries that Russian threat actors targeted the most in 2021:
United States — 55%
United Kingdom — 8%
Canada — 3%
Germany — 3%
Switzerland — 2%
Ukraine — 2%
Other — 27% [Microsoft]
The countries that Chinese threat actors targeted the most in 2021 are: [Microsoft]
United States — 54%
United Kingdom — 7%
Canada — 5%
Taiwan — 5%
Italy — 3%
Other — 26% [Microsoft]
Check out the top ten countries with the most reported cyberattacks in 2021:
United States — 466K
United Kingdom — 304K
Canada — 57K
India — 3.1K
Australia — 2.2K
France — 2K
South Africa — 1.8K
Germany — 1.4K
Mexico — 1.3K [FBI]
According to Malwarebytes, the most common malware category to affect Europe and the Middle East in 2021 are heuristic malware (33%), trojan (17%), adware (15%), RiskwareTool (14%), HackTool (8%), spyware (4%), virus (3%), worm (3%), backdoor (2%), and OSX (1%). [Malwarebytes]
The most common malware category to affect North America in 2021 are heuristic malware (41%), adware (18%), trojan (15%), RiskwareTool (8%), OSX (7%), exploit (3%), HackTool (3%), spyware (3%), rogue (1%), and backdoor (1%). [Malwarebytes]
The sector most targeted by malware is Education, with 1,605 attacks per organization on average each week, a 75% increase. The category Software Vendor shows the highest year-over-year growth, with a rise of 146%. [CheckPoint]
Cybersecurity Vulnerabilities
A cybersecurity vulnerability is a flaw attackers can use to get around security measures and access IT systems without authorization.
The Log4j vulnerability was the most exploited in 2021. SonicWall logged an average of 2.8 million exploits daily between December 2021 and June 2022, totaling 557.5 million. [SonicWall]
The Log4j vulnerability was one of the top five new vulnerabilities discovered in 2021. [IBM Security]
Exploits of the Log4Shell vulnerability affected 48.3% of organizations in 2021. [CheckPoint]
The number of incidents brought on by vulnerability exploitations increased by 33% between 2020 and 2021. [IBM Security]
At least ten known critical vulnerabilities were present in 32% of the firmware images Microsoft examined. [Microsoft]
Researchers discovered 18 zero-day vulnerabilities in Google Chrome. The Just In Time (JIT) compiler contained most of the vulnerabilities. [Malwarebytes]
In July 2021, the REvil criminal organization infected at least 800 organizations with ransomware using a security flaw in the Kaseya VSA remote monitoring tool. It was a devastating supply-chain attack. [Malwarebytes]
Malware
Malware, or malicious software, is any program or file that may cause damage to software, networks, or servers.
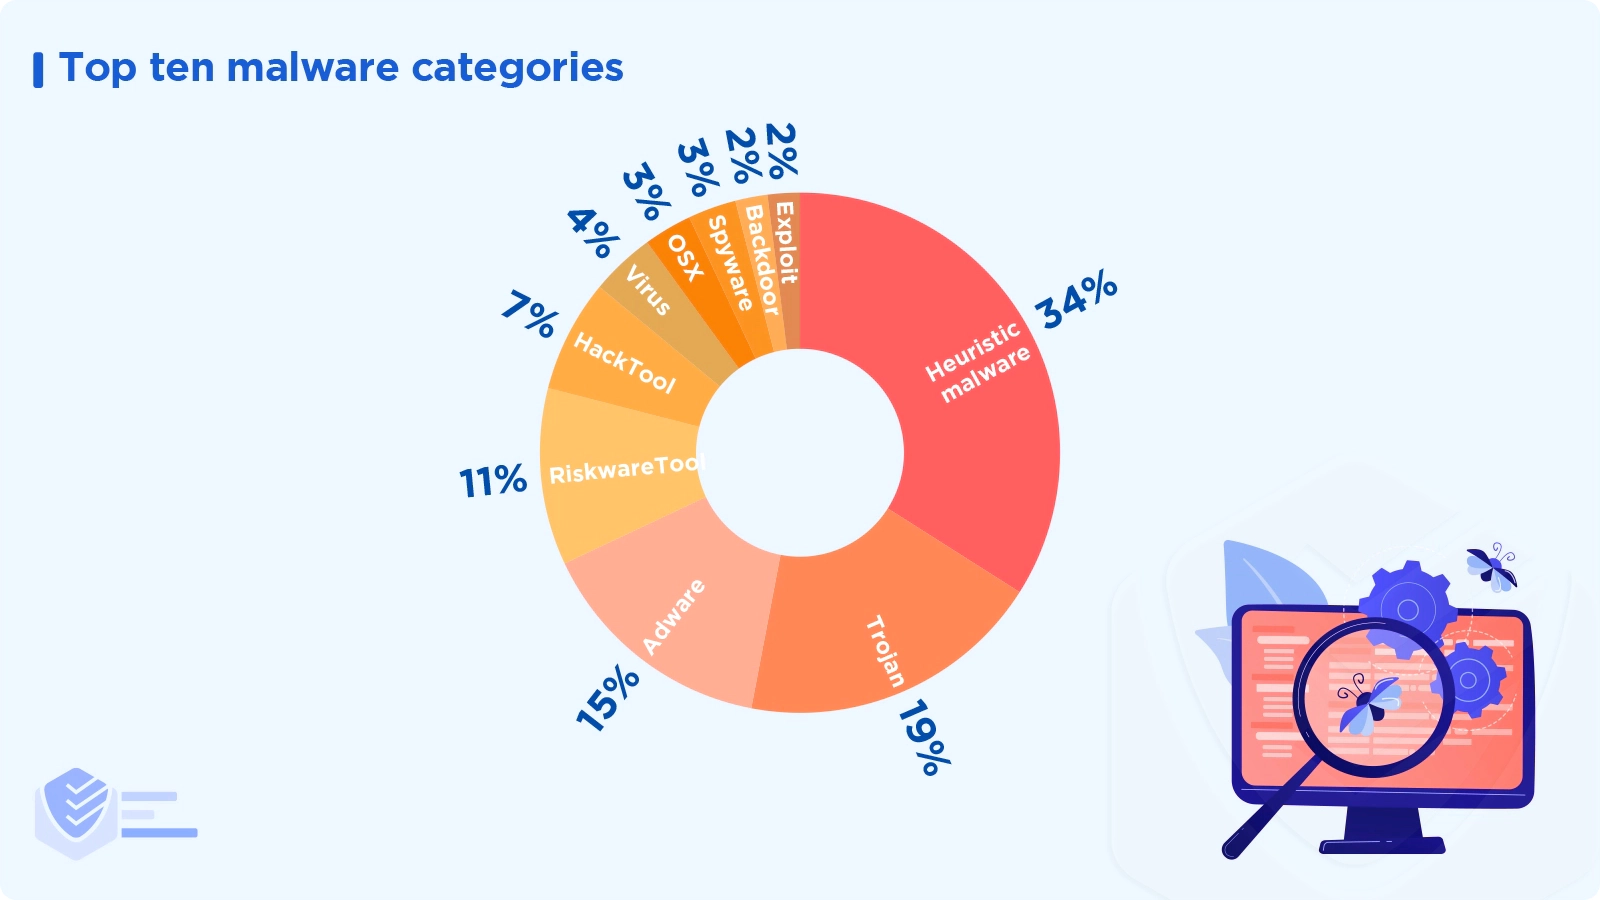
The top ten malware categories worldwide in 2021 were heuristic malware (34%), trojan (19%), adware (15%), RiskwareTool (11%), HackTool (7%), virus (4%), OSX (3%), spyware (3%), backdoor (2%), and exploit (2%). [Malwarebytes]
In the first half of 2022, a total of 270,228 new malware variants were found. That represents a 45% rise year to date. [SonicWall]
The number of new malware variants found in 2022 has skyrocketed by 2,079% since the beginning of 2018. [SonicWall]
In 2021, the five most widespread malware threats included TA551 (10.2%), which is a threat group, and the malware families Mimikats (8.8%), Cobalt Strike (7.9%), Qbot (6.8%), and Impacket (5.9%). [Red Canary]
Cyber attacks increased by just 2% in North America in 2021, which typically has the highest volume of malware; this increase is significantly less than the global average. [SonicWall]
Malware volume increased by 29% in Europe and 32% in Asia. [SonicWall]
The safest nation in terms of malware is Luxembourg, where a company has a 7.3% probability of experiencing an attack. [SonicWall]
The US states with the most malware attacks are Florida (140M), California (140M), New York (133M), Illinois (105M), Texas (99M), Minnesota (81M), Rhode Island (69M), New Jersey (49M), South Carolina (46M), and Maryland (63M). [SonicWall]
At a monthly average of 21.4%, users in the education received the most malware attacks. Consumers in the government industry come second at 19.3%. [SonicWall]
Compared to 2020, the number of cyberattacks against corporate networks worldwide increased by 50% in 2021. [CheckPoint]
The top malicious file types on the web are exe (52%), pdf (20%), doc (5%), xls (3%), xlsx (3%), jar (2%), bat (2%), docx (1%), ps1 (1%), apk (1%), and other (10%). [CheckPoint]
The top malicious file types in emails are exe (34%), xlsx (16%), pdf (9%), rtf (7%), doc (7%), xlsm (6%), docx (6%), xls (5%), xlsb (3%), ppt (2%), and other (6%). [CheckPoint]
Executables accounted for 34% of newly discovered malicious files in Q1–Q2 2022, a significant increase from 26.4% in Q4 of the previous year. Office files constitute about 10% of new harmful file types, while PDFs make up 18%. [SonicWall]
Since the start of 2020, the use of email as an attack vector has steadily increased while the use of websites to distribute malware payloads has decreased. In 2019, email was used in 64% of attacks, and the web was 36%. In 2020, the percentages were 83% for email and 17% for web, and in 2021, it was 84% vs 16%. [CheckPoint]
Pirated movie downloads often contain some sort of malware, including Potentially Unwanted Programs or PUPs (39%), viruses & worms (26%), adware (15.5%), miners (5%), trojan droppers (5%), info stealers (4%), ransomware (3%), and Remote Access Trojans or RATs (3%). [Reasonlabs]
In comparison to 2020, Malwarebytes discovered around 77% more harmful malware on Windows in 2021 (150 vs 95 million). Windows residential PCs had a 65% rise in detections, while Windows business computers saw a 143% increase. [Malwarebytes]
Here’s the global attack rate of each type of malware on corporate networks in 2021:
Top Five Malware Families of 2021
Dridex (58%) — An active family of banking trojans that has been spotted in the wild since 2011. It uses Microsoft Word macros to steal bank credentials.
Emotet (13%) — When it first appeared in 2014, it served as a banking trojan. It was spread through spam campaigns that mimicked financial statements, transfers, and invoice payments. It caused around $ 2.5 billion in losses.
AgentTesla (10%) — This spyware has been available for purchase online since 2014. It is promoted as a reliable monitoring program. Its operators can use Agent Tesla for malicious purposes thanks to its password extraction capabilities and features designed to avoid detection.
Trickbot (10%) — An advanced banking virus that targets people and businesses to obtain access to bank account passwords, financial data, and personal information.
IcedID (09%) — A banking trojan that mainly targets the financial sector (banks, credit card companies, and e-commerce websites). [Deep Instinct]
Botnets
The most prevalent botnet families globally are TrickBot (29%), Qbot (14%), Emotet (13%), Dridex (12%), Phorpiex (10%), Glupteba (10%), and other (12%). [CheckPoint]
In 2021, the Mozi botnet was the source of 74% of attacks on IoT devices. [IBM Security]
Infostealers
The top infostealer malware globally includes Formbook (16%), AgentTesla (13%), Raccoon (9%), LokiBot (9%), Vidar (8%), NanoCore (7%), and Other (38%). [CheckPoint]
Trojans
The most common trojan families affecting consumers in 2021 are Coin miners (58%), Backdoors (22%), Infostealers (9%), RATs (6%), Spyware (2%), Ad Hijackers (1.5%), Droppers (1%), and Financial/banking trojans (0.5%). [CheckPoint]
The most common banking trojans worldwide in 2021 were TrickBot (30%), Qbot (14%), Dridex (12%), Ursnif (8%), Ramnit (8%), IcedID (7%), and others (21%). [CheckPoint]
The most prevalent Remote Access Trojans (RATs) in Q3 2022 were njRAT, Warzone, Remcos, AsyncRat, NanoCore, NetWire, QuasarRAT, PoisionIvy, Adwind, and Orcus. [Avast]
Rootkits
40% of rootkit activity in Q3 2022 comes from R77RK developed by bytecode77. It may be used to conceal files, directories, processes, services, and more, and it is compatible with Windows 7 and Windows 10. [Avast]
R77RK, a rootkit created by bytecode77, accounted for 40% of rootkit activity in Q3 2022. [Avast]
Viruses
The most prevalent virus families affecting consumers are Ramnit (34%), Floxif (19%), Neshta (11%), Sality (9%), Chir (8%), Ground (8%), Wapomi (6%), Jeefo (4%), and Expiro (2%). [Reasonlabs]
Adware
The most common adware families that consumers faced in 2021 include adware browser modifiers (65%), bundlers (16%), ad popup scripts (15%), stagers (2.4%), and installers (1%). [Reasonlabs]
Mac Malware
Malware detections on Mac climbed by more than 200% year over year in 2021, reaching 164 million. [Malwarebytes]
The most common malware on Mac are PUPs (89.8%), adware (9.8%), and others (0.4%). [Malwarebytes]
According to Elastic Security Labs, MacKeeper was the sole source of almost 50% of the malware found on macOS in 2022. Although they do not classify the program as malware, it can be misused. [Elastic Security Labs]
Encrypted Attacks (Malware Over HTTPS)
The volume of encrypted attacks (malware over HTTPS) reached record levels between January and July 2022 due to a rise of 132% year-to-date. [SonicWall]
While the number of encrypted attacks in January 2022 was exceptionally low at just 280,896, it increased to 1.5 million by May. [SonicWall]
3.34 million encrypted threats have been reported in North America in Q1-Q2 2022, a 284% increase year-to-date. [SonicWall]
Ransomware
Ransomware is malicious software intended to prevent the use of a computer system or files unless a certain amount of money is paid.
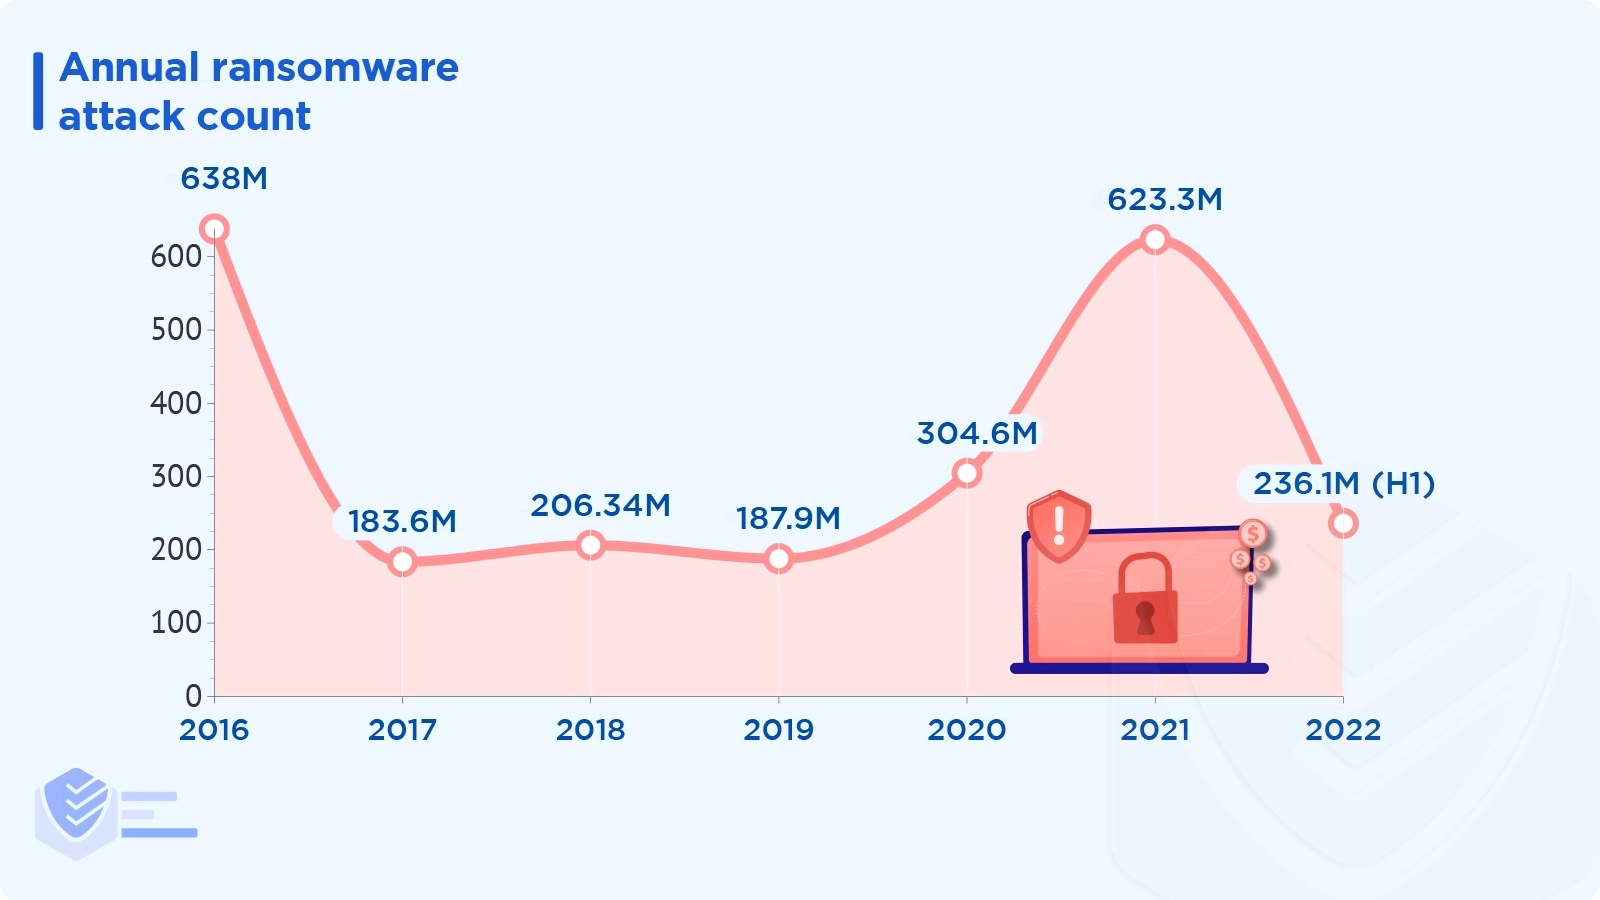
In 2021, there were 623.3 million ransomware attacks globally, and in 2020, there were 304.6 million. [Statista]
There were 236.1 million ransomware incidents in the first half of 2022. [Statista]
Most ransomware attacks are human-operated, infect 33% of targets, and receive payment from 5% of victims. [Microsoft]
The most used pre-ransomware tools in Q2-Q4 2021 are PsExec (34%), Cobalt Strike (18%), Mimikatz (11%), VssAdmin (10%), and NetScan (7%). [Microsoft]
A macro-enabled Microsoft Word document (VBA macro) or Excel 4.0 macro served as the initial attack vector in 55% of all pre-ransomware occurrences in Q1 2022. That number decreased to 9% in Q2. This is likely a reaction to Microsoft's announcement that MS Office will automatically block macros. [Expel]
The legal and entertainment sectors were the most frequently targeted by ransomware threat groups, accounting for 34% of all incidents. The following two sectors, manufacturing and logistics, accounted for 24% of pre-ransomware. [Expel]
The number of ransomware infections targeting consumers decreased in 2021. This was most likely caused by the fact that ransomware mostly targets businesses, where ransoms are 1000 times higher. [Reasonlabs]
The top consumer ransomware in 2021 is WannaCry (40%), followed by Cerber (20%), GrandCrab (15%), Locky (10%), LockBit (5%), and Maze (2%). [Reasonlabs]
Despite a 38% decrease in ransomware volume in 2021, the high-profile attacks on the Colonial Pipeline, the Health Service Executive in Ireland, and JBS were nationwide calamities. [Malwarebytes]
In 2021, ransomware was used in nearly 70% of data breaches involving malware. [Verizon]
The use of desktop-sharing software accounts for 40% of ransomware incidents. Email comprises 35%, web applications about 17%, and direct installs 8%. [Verizon]
Looking for more ransomware statistics? Read our comprehensive list.
IoT Malware
IoT technology, such as smart home systems, activity trackers, or smart wearables, is vulnerable to malware. Check out the latest IoT malware stats.
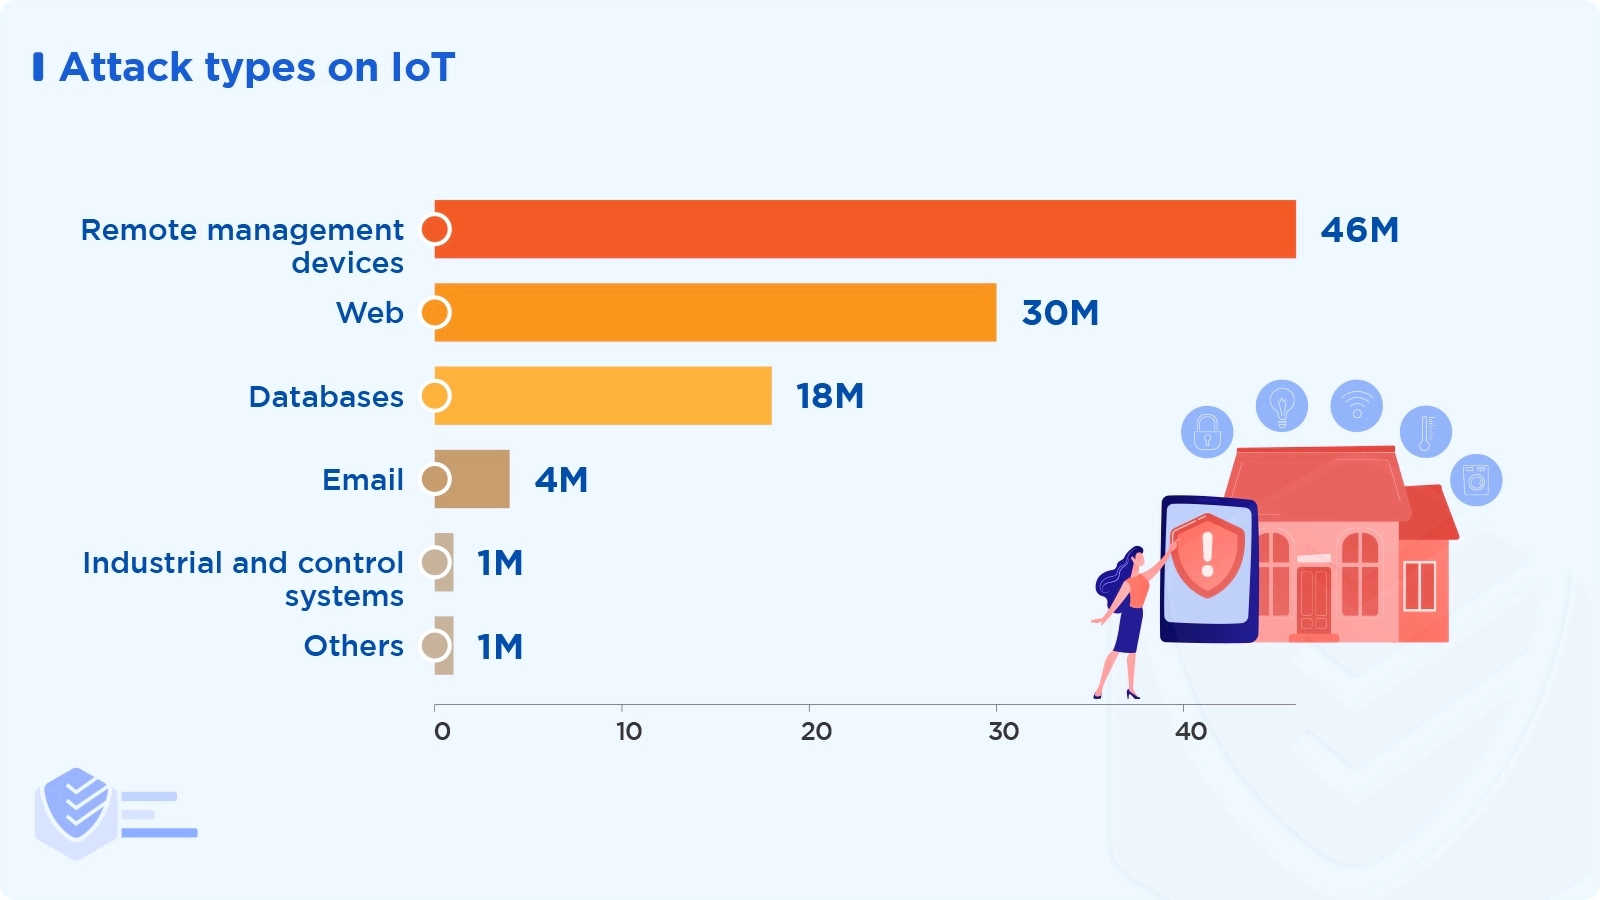
According to Microsoft Threat Intelligence Center (MSTIC), the most prevalent attack types on IoT were attacks against remote management devices (46%), attacks via the web (30%), and attacks on databases (18%). Other attack types include email (4%), industrial and control systems (1%), and others (1%). [Microsoft]
IoT malware attacks totaled 57 million in Q1–Q2 2022, up 77% year to date. These are the worst quarters in what concerns IoT malware. [SonicWall]
June 2022 was the month with the most significant IoT malware volume, with 12.9 million detections. [SonicWall]
In North America, IoT malware attack volumes increased by 222% in June 2022 with 8.1 million incidents. [SonicWall]
The worst hit sector by IoT malware in 2022 was finance, where the volume increased by 151%, followed by healthcare (up 123%), retail (up 122%), government (up 114%), and education (up 110%). [SonicWall]
The top IoT malware families detected in the wild are Mirai with 103K detections, Gafgyt with 87K incidents, Miner with 12K attacks, Tsunami with 10K detections, and Xhide with 3.2K incidents. [Microsoft]
Phishing
Phishing is the most prevalent attack vector for cybercriminals. Check out the latest facts about phishing.
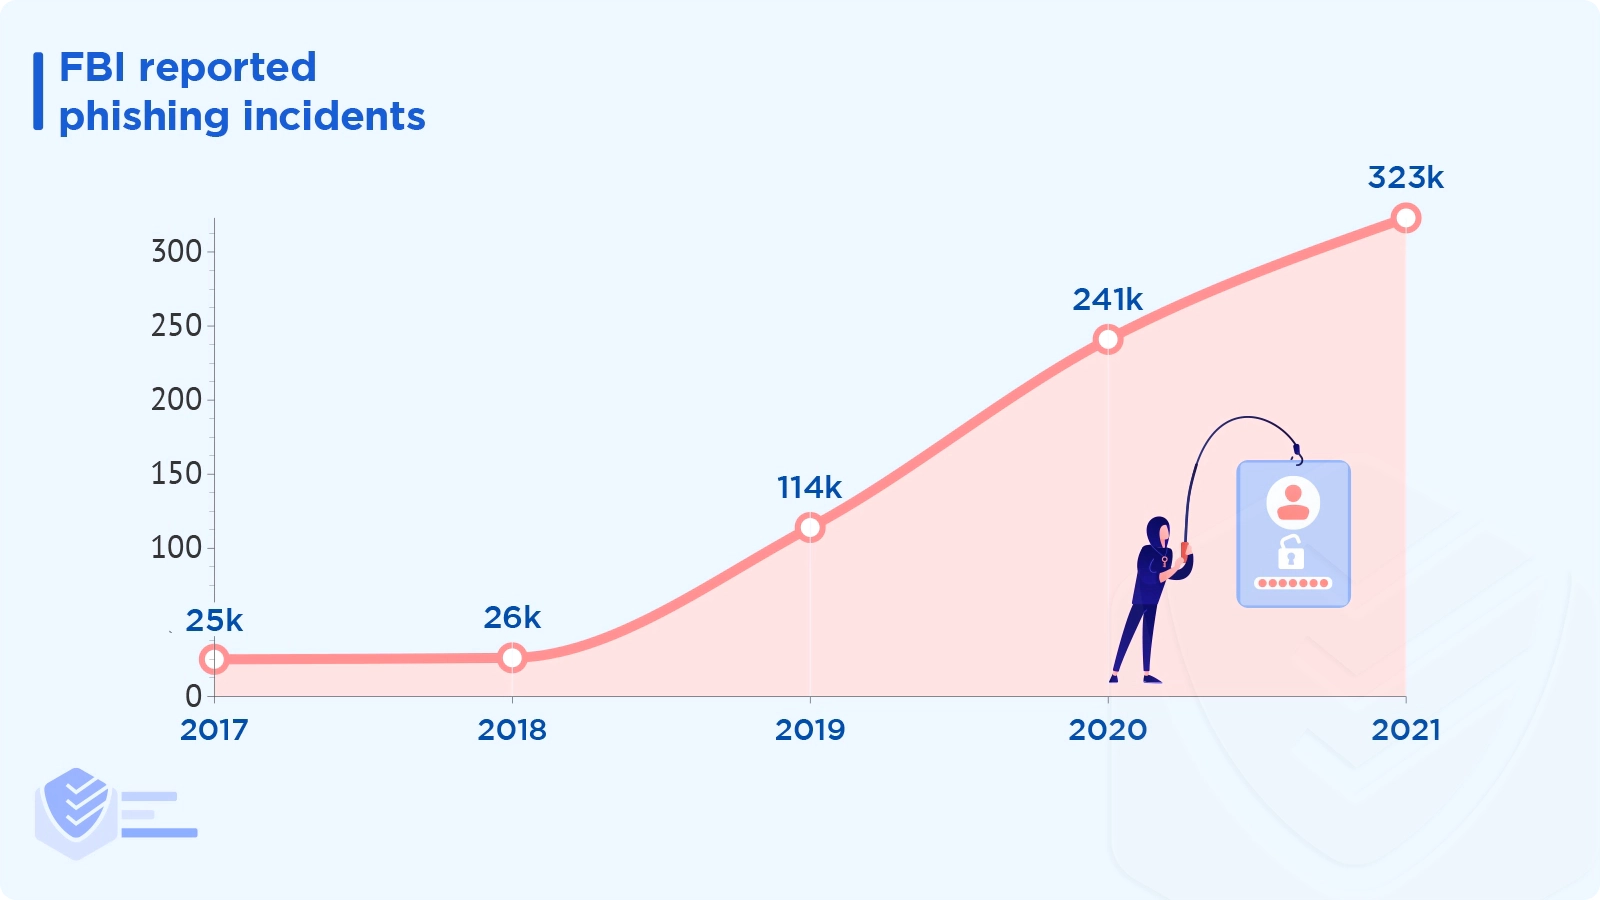
In 2021, there were 34% more phishing incident reports than in 2020 and almost 13 times as many as in 2017. [FBI]
In 2021, Proofpoint detected:
More than 350,000 credential phishing emails
A little over 40,000 emails with malware payloads, including trojans, downloaders, keyloggers, and ransomware
Over 20,000 spam emails with malicious intent
More than 8,500 emails linked to spambots or botnets
Over 8,000 attacks utilizing banking Trojans or remote access software
6,000 or more attacks with downloaders [Proofpoint]
Microsoft's Digital Crimes Unit removed 531,000 different phishing URLs that other parties than Microsoft hosted. [Microsoft]
51% of identity attack events involved business email compromise (BEC) and business application compromise (BAC). [Expel]
In Q2 2022, BEC in MS Office 365 (O365) continued to pose the greatest threat to businesses.
BEC attempts made up 45% of all Q2 incidents in O365; none occurred in Google Workspaces.
Legacy protocols were used to circumvent multi-factor authentication (MFA) in O365 in 19% of BEC attempts, up 16% from Q1. [Expel]
"Review document" and "Available?" were the two most popular subject lines in phishing emails that led to an employee click or compromise. [Expel]
Once you become a victim of a phishing email, it typically takes an attacker 1hr 12m to access your personal information. [Microsoft]
Between the first and second halves of 2021, email threat detections rose by 56%. But between 2017 and 2021, there has been a noticeable decline. [Malwarebytes]
Between 2018 and 2021, the top email threat detections were Dridex (20%), Trickbot (16%), AsyncRat (13%), Agent Tesla (8%), Smokeloader (7%), Emotet (6%), Nanocore (6%), Remcose (5%), DarkComet (5%), and others (14%). [Malwarebytes]
Want additional phishing statistics? We’ve created a separate, highly-detailed article.
Data Breaches
When data is removed from a system without the owner's knowledge or authorization, this is referred to as a data breach.
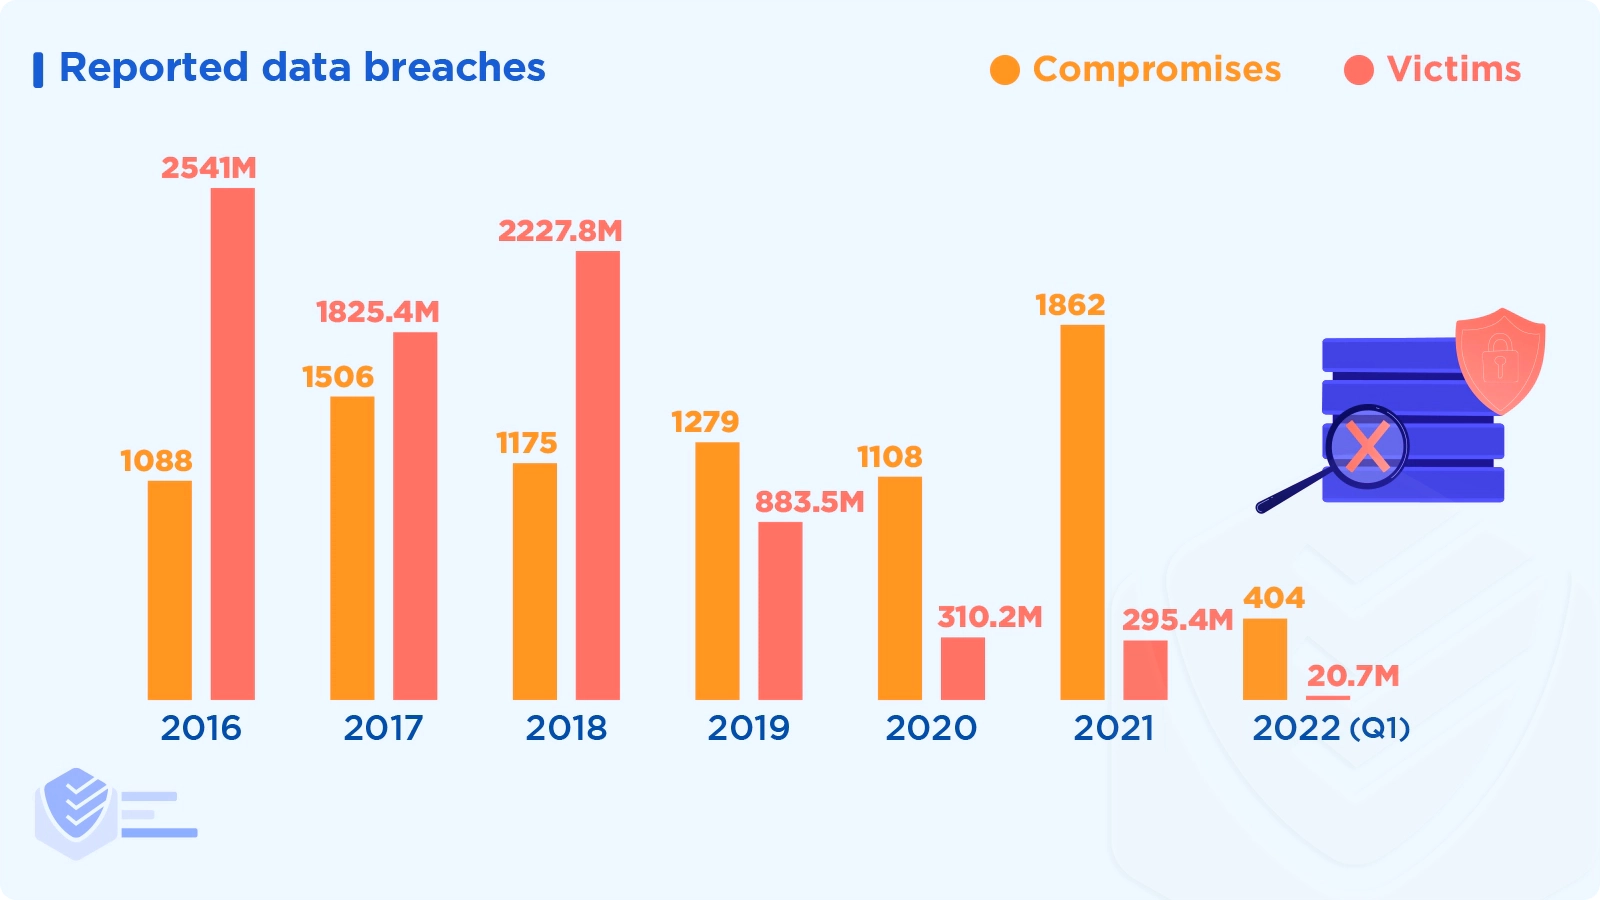
In Q1 2022, 404 data breach reports were filed with the Identity Theft Resource Center, a 14% increase from Q1 2021. [Identity Theft Resource Center]
In Q1 2022, fewer people became victims of data breaches. The 20.7M victims in this reporting period represent a reduction of 50% from Q1 2021. [Identity Theft Resource Center]
There were 1,862 reported data breaches in 2021 (with 295 million victims), a significant increase from the 1108 compromises in 2020 (with 310 million victims). [Identity Theft Resource Center]
Cyberattacks were to blame for over 92% of data breaches in Q1 2022. [Identity Theft Resource Center]
Phishing and ransomware are the top two root causes of data compromises. [Identity Theft Resource Center]
8% of data breaches in Q1 2022 resulted from system and human errors, such as improper firewall configuration or failure to configure cloud security. [Identity Theft Resource Center]
In the first quarter of 2022, 3% of data breaches were caused by physical theft or skimming devices. [Identity Theft Resource Center]
The three industry sectors with the most data breaches are manufacturing & utilities (52 attacks), financial services (68 incidents), and healthcare (73 attacks). The industries with the greatest number of victims, however, are technology (10,8 million), financial services (3,3 million), and healthcare (2,5 million). [Identity Theft Resource Center]
The top attack vectors of data breaches are credentials theft, phishing, exploiting vulnerabilities, and botnets. [Verizon]
Human error, such as using stolen credentials, phishing, and misconfigured cloud storage, accounted for 82% of data breaches in 2021. [Verizon]
External threat actors (those not part of the organization) commit 80% of data breaches. [Verizon]
On average, attackers compromise 80,000 records per data breach. [Verizon]
About 93% of perpetrators of data breaches are motivated by financial gain, about 6% by gaining company secrets, and about 1% by ideology.
In 2021, Denial of Service (DoS) accounted for 46% of all data breach incidents, followed by backdoor at 17%. [Verizon]
Around 20% of breaches involve a social action, while more than 30% involve malware. [Verizon]
41% of BECs involved phishing. Nearly half of the remaining 59% involved using credentials stolen from organizations. [Verizon]
Since 2017, there has been a nearly 30% increase in stolen credentials, making credential theft one of the most reliable ways to breach an organization’s data. [Verizon]
Intrusion attempts increased by 18% in the first half of 2022. However, the number of malicious intrusions (those of medium and high severity) decreased by 19% yearly to 5.7 billion. [SonicWall]
There were 608 million intrusion attempts in North America in June 2022, the most since January 2021. [SonicWall]
The number of intrusion attempts in Europe peaked in the first half of 2022 at 288.2 million, a 52% decrease from the first half of 2021. [SonicWall]
The volume of intrusion attempts rose across most industries. Government, finance, healthcare, and retail all experienced increases of 39%, 46%, 94%, and 200%, respectively. Malicious intrusions decreased by 11% in education. [SonicWall]
In Q4 2021, non-malware attacks made up 62% of all cyberattacks. Attackers adopted a strategy known as "living off the land" (LOTL), using legitimate credentials and built-in tools. [CrowdStrike]
The time it took an adversary to move laterally from one compromised host to another within the victim environment in 2021 — aka the breakout time — is 1h38m. [CrowdStrike]
Supply-Chain Attacks
A supply chain attack targets a trusted company, such as a software development firm, infecting its software or apps to distribute malware.
In 2021, 62% of system intrusion incidents were related to the supply chain. [Verizon]
Throughout 2021, software supply-chain attacks increased by 650%. [CheckPoint]
Only 16% of supply chain attacks used well-known software flaws; 66% took advantage of unknown vulnerabilities. [CheckPoint]
82% of businesses assign privileged responsibilities to the third-party vendors who make up their software supply chain. [CheckPoint]
76% of companies give third-party vendors access to roles that could lead to account takeover. Yet, 90% of designated security teams are unaware that these permissions are granted. [CheckPoint]
Successful data breaches in organizations through the supply chain have gone from 44% to 61% in 2021. [Accenture]
DDoS Attacks
Distributed denial-of-service (DDoS) attacks are malicious attempts to overwhelm a server, service, or network with an influx of Internet traffic to obstruct the regular traffic to the target.
Between Q3 2021 and Q2 2022, Microsoft mitigated an average of 1,955 DDoS attacks per day, a 40% increase over the previous year. [Microsoft]
The majority of DDoS attacks that were seen between Q3 2021 and Q2 2022 were brief. Approximately 28% of the attacks lasted under ten minutes, 26% lasted between ten and 30 minutes, 14% took between 31 and 60 minutes, and 22% lasted longer than an hour. [Microsoft]
The gaming sector remains the main target of DDoS attacks, which are primarily low-volume User Datagram Protocol (UDP) attacks and variations of the Mirai botnet. [Microsoft]
54% of the DDoS attacks discovered between Q3 2021 and Q2 2022 were directed at American targets; this trend may be partially explained by the fact that most Azure and Microsoft customers are located there. [Microsoft]
Basic security hygiene measures thwart 98% of DDoS attacks. [Microsoft]
Insider Threats
Insider threats are cyber attacks on an organization committed by its own employees.
In 2021, remediating an insider threat cost an organization an average of $15.4 million globally. [Ponemon Institute]
Companies needed an average of 85 days in 2021 to contain an insider threat, up from 77 days in the prior study. [Ponemon Institute]
In 2021, insider threats accounted for 26% of all incidents (1,749), costing $648,062 on average. [Ponemon Institute]
Over 3,800 attacks (56%) of the 6,803 reported attacks examined in 2021 were brought on by employee or contractor negligence. Malicious insiders started another 1,749 attacks (26% of all attacks), and the remaining 1,247 incidents (18%) were credential thefts. [Ponemon Institute]
The most popular technologies used to lessen the danger of insider threats are:
Data Loss Prevention (DLP) — 64%
Privileged Access Management (PAM) — 60%
User and Entity Behavior Analytics (UEBA) — 57%
Security Information and Event Management (SIEM) — 53%
Endpoint Detection and Response (EDR) — 50%
Insider Threat Management (ITM) — 41%
Other — 3%. [Ponemon Institute]
Mobile Threats
The hidden security risks on your dependable mobile device may surprise you.
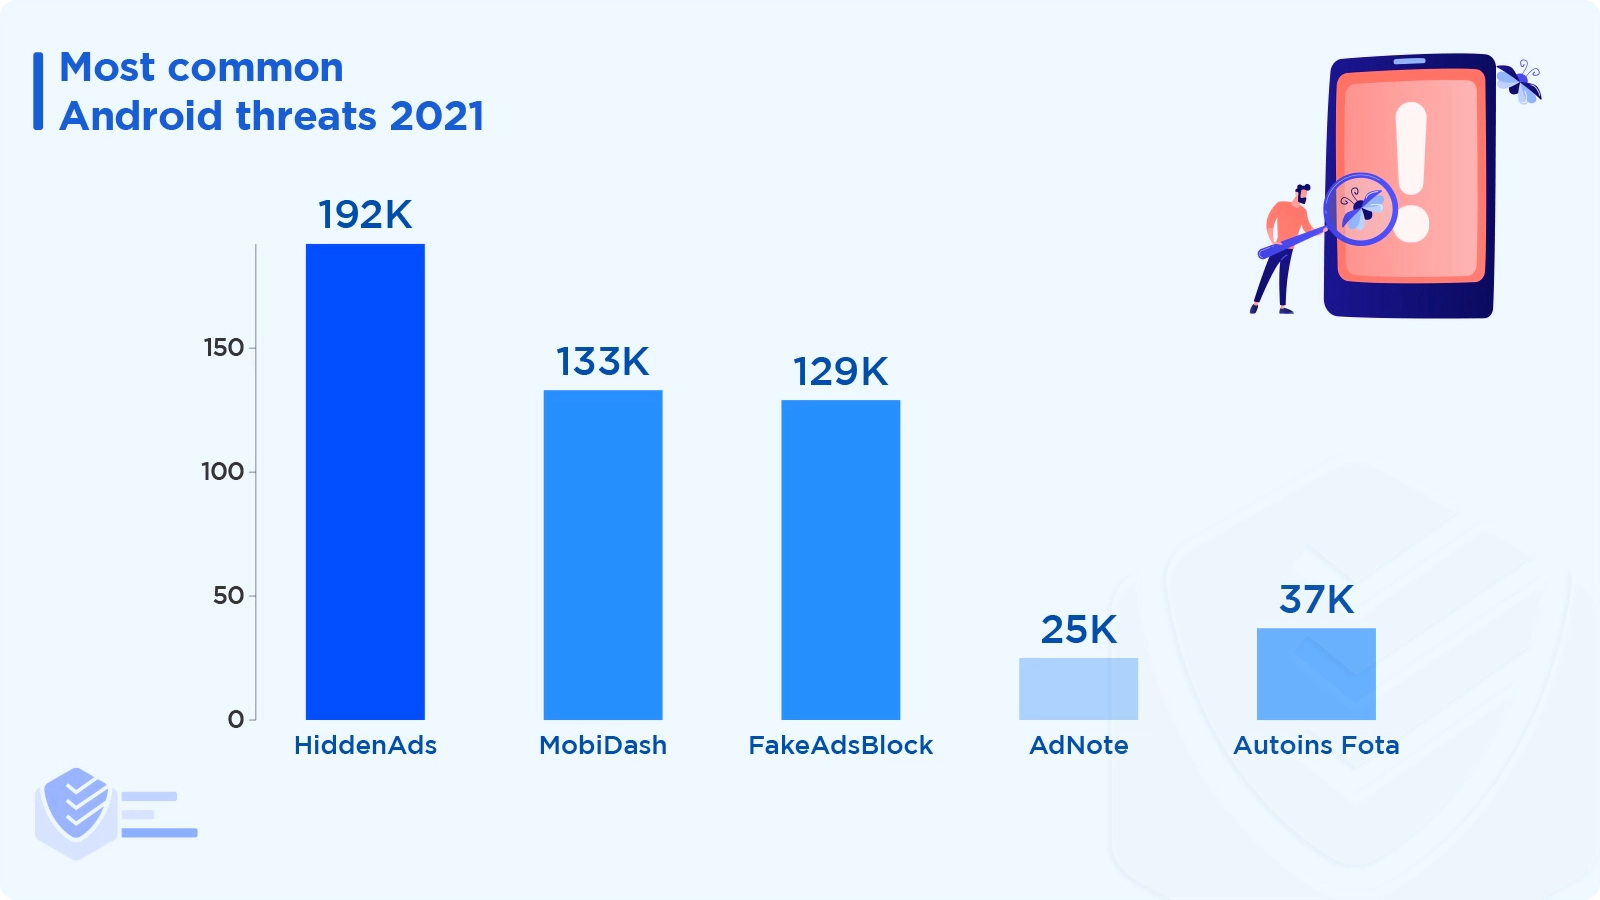
Ad-supported apps still dominated the Android threat landscape in 2021. Here are the most common adware variants:
HiddenAds, an Android trojan horse that aggressively displays ads, was the most common malware found on Android devices. Malwarebytes found 192,919 instances of 463 distinct variants. [Malwarebytes]
Another adware, MobiDash, amassed 133,179 detections by blending into the code of legitimate apps. [Malwarebytes]
AdNote was discovered 25,314 times on Google Play under the guise of various office-related apps. [Malwarebytes]]
Autoins Fota was found 37,701 times throughout 2021, even though in 2020, its detections declined. [Malwarebytes]
The trojan FakeAdsBlock was found 129,876 times. [Malwarebytes]
49% of organizations can’t identify an attack or incident on employee-owned devices. [CheckPoint]
The most common mobile malware families in 2021 are:
There are active Bring Your Own Device (BYOD) programs in 66% of the organizations, while in 11%, the policy is being considered. [Zimperium]
30% of respondents cited BYOD as their organization's top endpoint security concern. [Zimperium]
According to 42% of respondents, security incidents have been caused by web applications and mobile devices. Another 42% of respondents mentioned unlicensed applications and resources, and 10% said applications without authentication or encryption. [Zimperium]
Nearly 50% of those surveyed in 2021 claimed that their work-from-home policy played a significant role in cybersecurity incidents. [Zimperium]
In 2021, Microsoft Office was the target of more than 72% of attacks, with the browser version accounting for 13%. [Zimperium]
According to 45% of technology leaders, mobile devices have the weakest security. [Zimperium]
About cybersecurity strategies on mobile endpoints:
48% of businesses regularly review and tweak their cybersecurity plans.
26% of enterprises adapt their cybersecurity strategy as needed or in real-time.
23% of businesses have formal cybersecurity policies but rarely review them. [Zimperium]
In enterprises, 66% of smartphones and 55% of tablets are employee-owned. [Zimperium]
Malwarebytes counted 1,106 detections of Android spyware and 54,677 detections of Android monitor applications in 2021. This makes 2021 the worst year for stalkerware, as monitor app detections rose by 4.2% and spyware app detections grew by 7.2% year over year. [Malwarebytes]
Cryptojacking Threats
Cryptojacking means infecting a computer with malware that can mine cryptocurrencies.
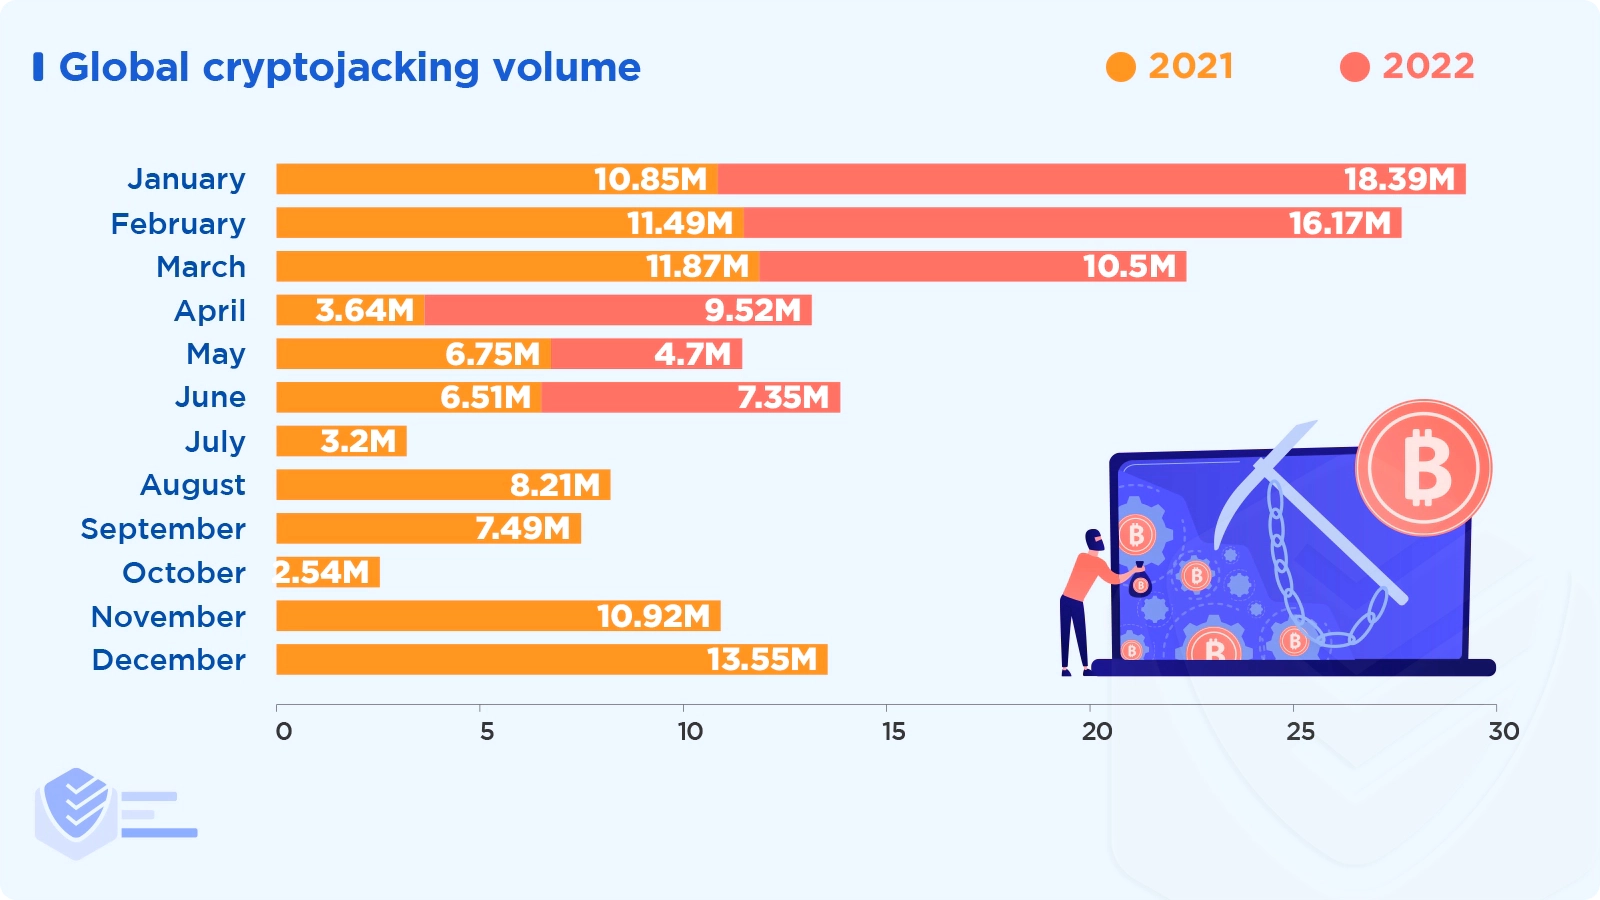
Global cryptojacking incidents increased to 66.7 million in H1 2022, up 30% from H1 2021, despite cryptocurrency prices declining. [SonicWall]
Cryptojacking activity peaked in January 2022 at 18.4 million. This set a new monthly record, surpassing the 15.49 million hits set in March 2020. [SonicWall]
While cryptojacking as a whole increased, attack volumes fell 78%, 87%, and 96% in the three sectors that are typically the most affected — government, healthcare, and education. [SonicWall]
The top cryptomining malware families in the world include XMRig (43%), LemonDuck (8%), RubyMiner (6%), WannaMine (6%), NRSMiner (4%), and others (33%). XMRig, a Monero mining tool, has seen a popularity increase of almost 25% from 2020 to now. [CheckPoint]
The use of cryptocurrencies like Bitcoin, Ethereum, Litecoin, or Ripple was the subject of 34,202 complaints to the IC3 in 2021.
Although there were fewer cryptojacking victims than in 2020 (35,229), the loss amount reported in IC3 complaints increased almost seven times, from $246 million in 2020 to over $1.6 billion in 2021. [FBI]
The IC3 received over 1,500 reports of scams involving cryptocurrency ATMs in 2021, resulting in losses of about $28 million. [FBI]
Cryptomining threat actors focused more on Taiwan (+69%), Chile (+63%), Thailand (+61%), Malawi (+58%), and France (+58%) in Q2 2022 compared to Q4 2021. The risk of contracting an infection significantly decreased in Finland (-50%) and Denmark (-56%). [Avast]
Cyber Hygiene
Cyber hygiene describes the cybersecurity best practices that users and security professionals follow.
According to a 2021 survey, employees use one or more electronic devices for work, including laptops, desktop computers, tablets, and cell phones. Among these individuals:
73% claimed to have used at least one device provided by their employer.
74% of respondents said they use one or more of their personal gadgets for work-related tasks.
54% of people use a personal phone or smartphone for work, and 22% use a personal tablet.
Due to the pandemic, 44% of respondents claimed they work remotely (full-time or part-time).
83% of respondents reported receiving at least one suspicious communication by phone, email, text, or social media.
42% of respondents admitted to engaging in risky behavior (such as opening a malicious link, downloading malware, or disclosing personal information). [Proofpoint]
The private activities performed by employees on work-issued devices include (2021 vs 2019):
Check personal email (42% vs 79%)
Read news (40% vs 41%)
Research products, travel destinations, etc. (37% vs 37%)
Shop online (32% vs 27%)
Access social media (29% vs 34%)
Stream media (28% vs 25%)
Play games (23% vs 11%) [Proofpoint]
Only 30% of respondents say their work passwords are unique. Also, 23% of individuals state they save login information within a web browser, 21% use a password manager, and 14% rotate 1-4 passwords across accounts. [Proofpoint]
97% of poll participants claimed to have a Wi-Fi network at home. However, only 60% of respondents claimed that their network is password-protected. [Proofpoint]
Just 26% of respondents changed the default name of their network, 22% changed the default password or their router, and 18% checked for updates to router software. [Proofpoint]
Cybersecurity Training
Many organizations regularly train their employees on cybersecurity matters. Check out the latest facts.
Compared to 28% in 2020, 38% of firms report that they spent an hour on formal training in 2021. [FBI]
In a 2021 survey, 63% of working adults responded correctly when asked what the term “malware” was. Responses with "I'm not sure" comprised 17%, and 20% were incorrect answers. [Proofpoint]
When asked what phishing is, 53% of the survey participants responded correctly, 20% weren’t sure, and 27% were incorrect. They were asked the same about ransomware, and the results were: 36% correct, 31% unsure, and 33% wrong. [Proofpoint]
85% of those who participated in the infosec and IT survey said they had a favorable opinion of the security culture at their company. Only 1% of respondents expressed a negative opinion, while 14% were neutral. [Proofpoint]
52% of working adults are confident their IT team can locate and resolve cybersecurity-related issues with work devices without their involvement. [Proofpoint]
Cybersecurity is not a high priority for their company, according to 35% of infosec and IT professionals. [Proofpoint]
Healthcare, financial services, energy/utilities, manufacturing, and technology were the sectors that conducted the most phishing (penetration) tests in 2021. [Proofpoint]
The average failure rate for almost 100 million simulated phishing attacks that contained links was 11%. Simulated phishing emails with attachments had a 20% failure rate, and 26% of employees were tricked by phishing involving data entry requests. [Proofpoint]
In 2021, the industries with the highest phishing reporting rate were Aerospace (26%), Electronics (26%), Energy/Utilities (24%), Financial (23%), and Legal (23%). [Proofpoint]
Sources
How Cybercriminals Are Stealing Your Ad Dollars — Bloomberg Law
Cybercrime To Cost The World $10.5 Trillion Annually By 2025 — Cybersecurity Ventures
Cybercrime an estimated $42 billion cost to Australian economy — UNSW Canberra
2022 Cyber Threat Report - Mid-Year Update — SonicWall
The State of Ransomware 2022 — Sophos
Microsoft Digital Defense Report 2022 — Microsoft
X-Force Threat Intelligence Index 2022 — IBM Security
2021 INTERNET CRIME REPORT — FBI
2022 THREAT REVIEW — Malwarebytes
Cybersecurity Report 2022 — CheckPoint
2022 Threat Detection Report — Red Canary
2022 Cyber Threat Landscape Report — Deep Instinct
Q1/2022 Threat Report — Avast
The State of Consumer Cybersecurity 2022 — Reasonlabs
Quarterly Threat Report – Q2 2022 — Expel
Data Breach Investigations Report — Verizon
2022 State of the Phish — Proofpoint
Global Mobile Threat Report 2022 — Zimperium
2022 Cost of Insider Threats Global Report — Ponemon Institute
State of Cybersecurity Resilience 2021 — Accenture
2022 Global Threat Report — CrowdStrike
First Quarter 2022 Data Breach Analysis — Identity Theft Resource Center
Ransomware: The True Cost to Business 2022 — Cybereason
Global Threat Report Vol. 1 2022 — Elastic Security Labs
Octav Fedor (Cybersecurity Editor)
Octav is a cybersecurity researcher and writer at AntivirusGuide. When he’s not publishing his honest opinions about security software online, he likes to learn about programming, watch astronomy documentaries, and participate in general knowledge competitions.