According to the FBI, phishing is by far the costliest and most widespread type of cybercrime. Businesses and consumers receive billions of phishing threats every year, and the combined global losses are almost $3 billion.
Phishing can also open the door to sinister threats like ransomware attacks and large-scale data breaches. That’s why it’s so important to be aware of the impact of phishing.
This article deals with the latest phishing statistics. We’ll provide in-depth stats on:
The prevalence of phishing attacks
Countries targeted by phishing
Which industries phishing attackers target
The financial damage of phishing attacks
Phishing training results
And much more…
Let’s begin.
The volume of phishing attacks
Phishing attacks are extremely widespread, as it’s increasingly simple for criminals to reach people’s inboxes or phone numbers.
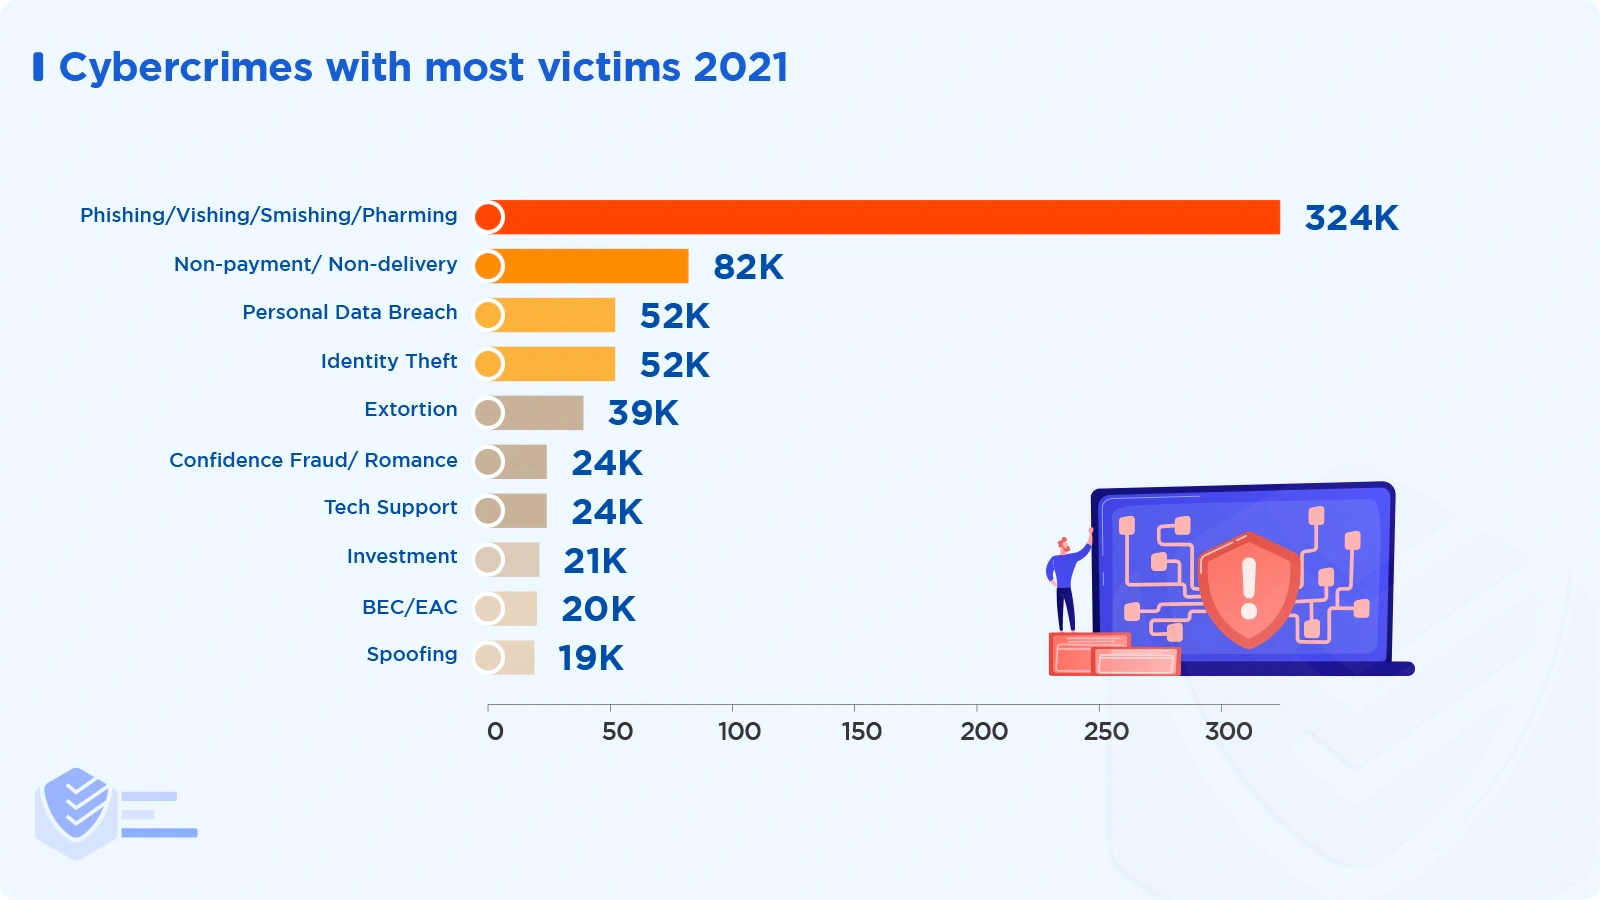
Phishing is the most widely spread type of cybercrime in 2021 in the US — 323,972 incidents were reported. [FBI]
The reported number of phishing incidents in 2021 is 34% larger than in 2020 and almost 13 times bigger compared to 2017.
2021: 323,972
2020: 241,342
2019: 114,702
2018: 26,379
2017: 25,344 [FBI]
In 2021, more than 80% of businesses saw at least one successful phishing attack. Ransomware was a problem for nearly 70% of workers. [Proofpoint]
Phishing is used in 41% of initial attacks on systems. In 2021, phishing operations were the most common method in data breaches, accounting for 41% of remediated events. [IBM Security]
The top two causes of data intrusions in Q1 2022 are phishing and ransomware. [Identity Theft Resource Center]
In 2021, experts discovered 15 million phishing emails containing malware payloads connected to several ransomware incidents. The most prevalent malware families were Dridex, The Trick, Emotet, Qbot, and Bazaloader. [Proofpoint]
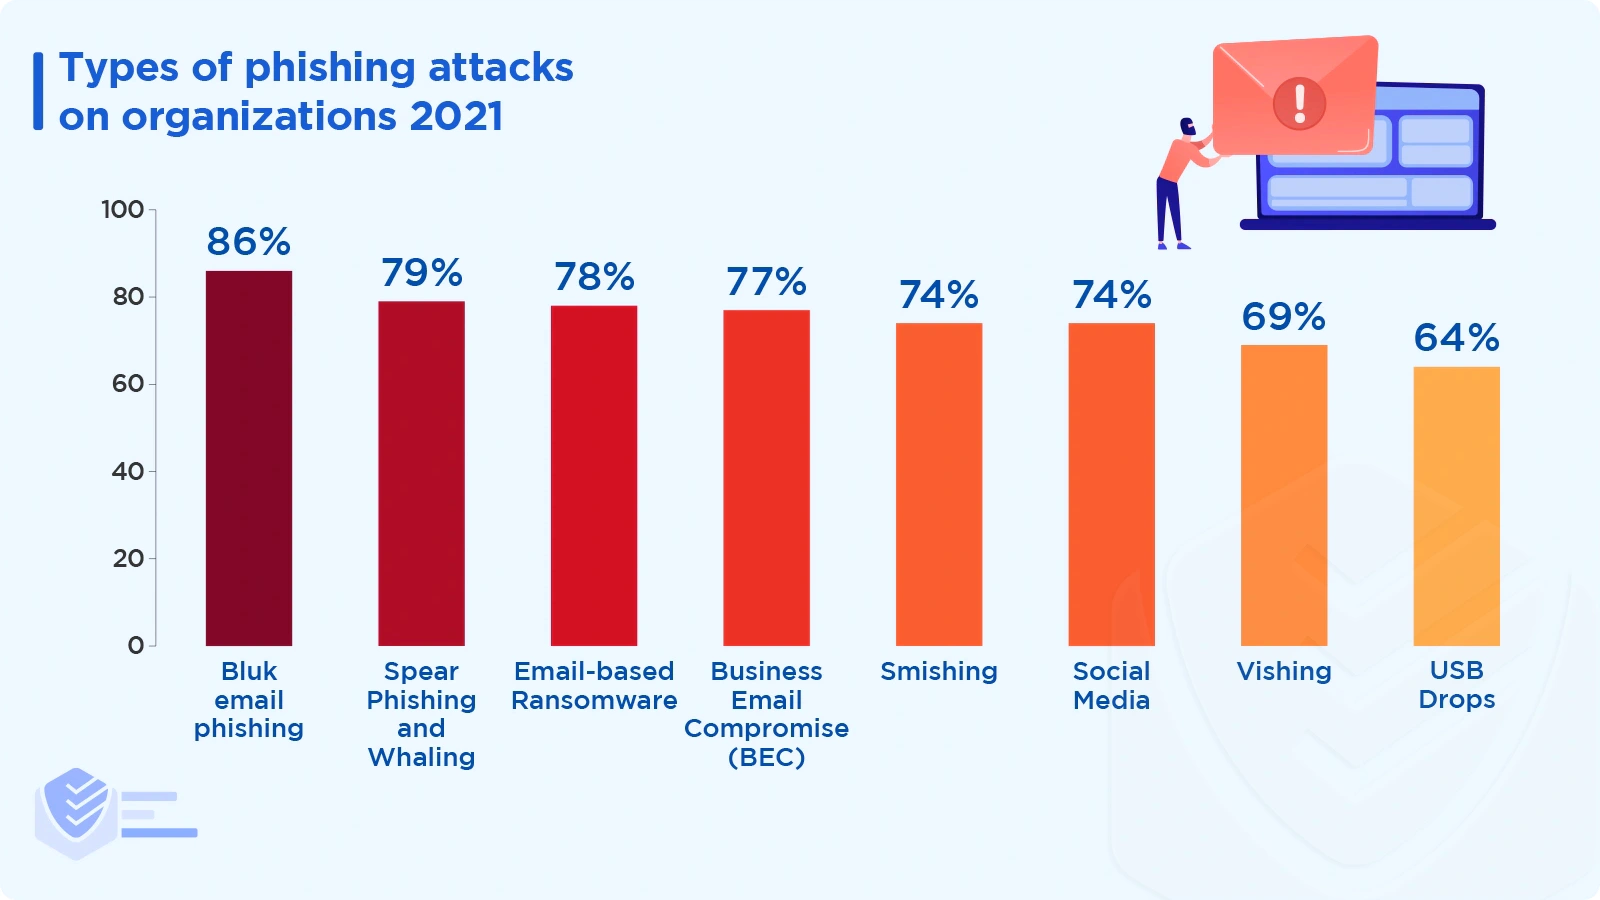
In 2020, bulk phishing attacks, spear phishing attacks, and business email compromises (BECs) affected 77%, 66%, and 65% of organizations, respectively. In 2021, bulk phishing attacks increased by 12% from the previous year. Also, spear phishing and BEC reports increased by 20% and 18%, respectively. [Proofpoint]
In 2021, the percentage of organizations that faced smishing, social attacks, vishing, and USB drop attacks were 74%, 74%, 69%, and 64%, respectively. [Proofpoint]
In 2021, there were 2,249 social engineering incidents, out of which 1,063 had data breaches. All threat actors were external, and their motives were financial (89%) and espionage (11%). The compromised data includes credentials (63%), internal (32%), personal (24%), and other (21%). Also, 82% of the breaches were caused by human error. [Verizon]
The second quarter of 2022 saw 1,097,811 phishing attacks, setting a new record and ranking as the worst quarter for phishing. [APWG]
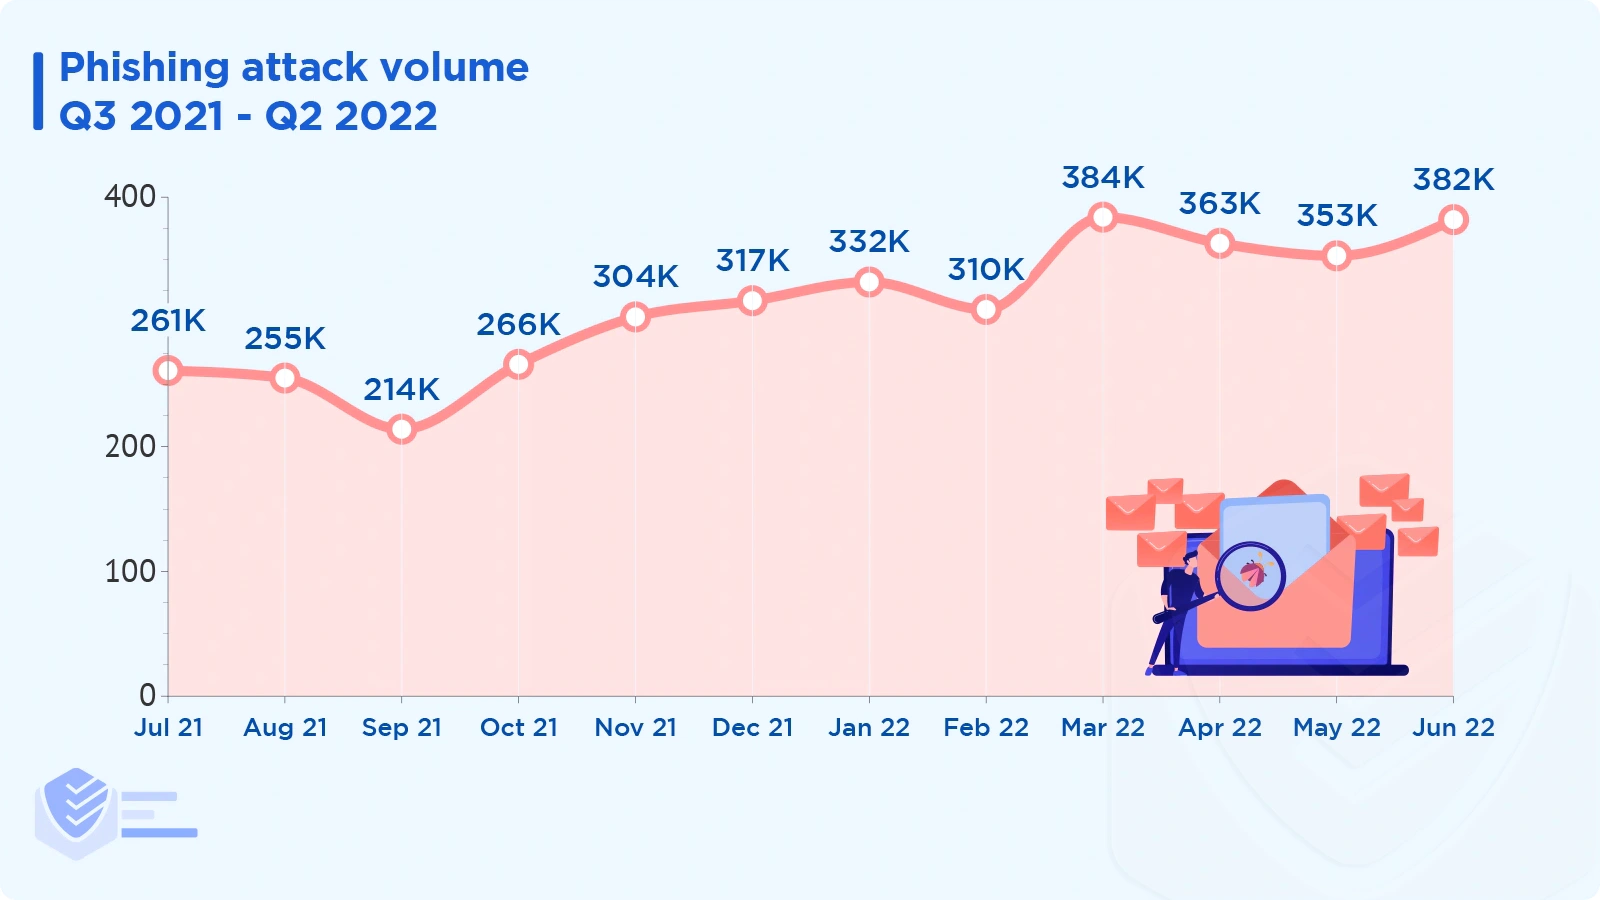
Between Q3 2021 and Q2 2022, there was a steady increase in the number of reported phishing attacks: from a little over 250,000 to almost 400,000. [APWG]
Unique phishing site detection increased dramatically since Q3 2020 when 571K phishing sites were discovered. [Statista]
In comparison to 2020, phishing attacks increased by 29% in 2021. [Zscaler]
In 2022, there were more than 9 billion phishing emails. [EasyDMARC]
The EasyDMARC platform stopped more than 15 million phishing attempts in the first half of 2022. [EasyDMARC]
89% of organizations said they were subjected to phishing attacks between January and June 2022. [EasyDMARC]
From January to June 2022, a startling 62,9% more phishing attacks were found compared to the previous period, which is a 30% quarterly increase. [EasyDMARC]
DMARC policies that customers used led to a quarantine of over 10 million emails. [EasyDMARC]
In 2021, Tuesday was the most popular day for phishing, with Monday and Wednesday in second and third place, respectively. [Vade]
Malicious phishing URLs increased by 61% between Q4 2021 and Q2 2022. [SlashNext]
Mobile devices account for 18% of all phishing email clicks [Verizon].
In Q1–Q2 2022, mobile phishing attacks increased. According to 83% of organizations, mobile device threats are more common than other threats. [Verizon]
Out of 500,000 phishing websites, those that targeted mobile devices specifically increased from just under 50% in Q1 2019 to more than 3/4 in Q4 2021. [Zimperium]
Zero-hour attacks make up 54% of threats in 2022, an increase of 48% from 2021. [SlashNext]
In Q1–Q2 2022, 76% of the zero-hour attacks used spear phishing (for credential harvesting), 15% involved frauds, and 1% involved malware, ransomware, and vulnerabilities. [SlashNext]
Countries targeted by phishing attacks
No country is spared when it comes to phishing. However, some countries are more attacked than others. Check out the phishing statistics on the countries with the most attacks:
Most phishing attacks (over 18% of all attacks) were directed at the Netherlands. Russia, Moldova, the USA, and Thailand are listed after the Netherlands. [EasyDMARC]
Thailand has the most blocked phishing emails — over 45% of all phishing attacks. The USA, Germany, China, and Brazil follow Thailand. [EasyDMARC]
Industries targeted by phishing attacks
Phishing scammers usually target people who work in lucrative industries like banking or payment. Here’s more data:
In Q2 2022, the financial sector was the industry with the largest number of phishing attacks — 27.6%. [APWG]
The most attacked industry — finance — experienced an increase of 5,8% quarter over quarter. [EasyDMARC]
Threats on social media grew by 47% in Q1-Q2 2022. Three out of every four social media assaults were caused by impersonation and fraud. [APWG]
Legal and professional services accounted for 31% of the top 30 domains that were flagged for external account takeover (ATO) between Q3 2020 and Q2 2021. [Tessian]
The healthcare sector experienced the most zero-hour spear phishing attacks in Q1–Q2 2022 — 86%. [SlashNext]
The cost of phishing attacks
The financial impact of phishing increases each year, affecting both consumers and businesses. The latest phishing cost statistics include:
Business Email Compromise (BEC) schemes — a subcategory of phishing — generated 19,954 complaints in 2021, with an estimated loss of close to $2.4 billion. That makes BECs the costliest type of cybercrime. [FBI]
Broader phishing, vishing, smishing, and pharming attacks, which don’t target specific targets, racked up $44 million in losses in 2021. [FBI]
The FBI took action in 1,726 BEC complaints in 2021 that involved domestic US transactions with possible losses of $443,448,237. A monetary hold was put in place on about $329 million, resulting in a 74% recovery rate. [FBI]
Those who launch BEC attacks requested, on average, $109,467 per wire transfer in Q2 2022, up from $91,436 in Q1. [APWG]
Tech support fraud caused significant losses in 2021:
Victims in 70 different countries filed 23,903 complaints with the FBI about tech support fraud in 2021.
A 137% increase from 2020's losses brought the losses to over $347 million.
60% of victims are over 60 years of age. They suffered 68% of the losses, or almost $238 million. [FBI]
More than $956 million in losses were incurred by 24,299 victims in 2021 due to romance scams and confidence fraud. Romance fraud is the third costliest type of scam. [FBI]
Criminals' preferred cash-out methods in Q2 2022 were:
Gift card requests (39.9%)
Payroll diversion attempts (25.9%)
Advanced fee fraud (15.5%)
Wire transfers (9.6%)
Other (9.1%) [APWG]
The impact of phishing on businesses
The impact of successful phishing attacks on companies varies. Customer data breach seems to be the most common issue.
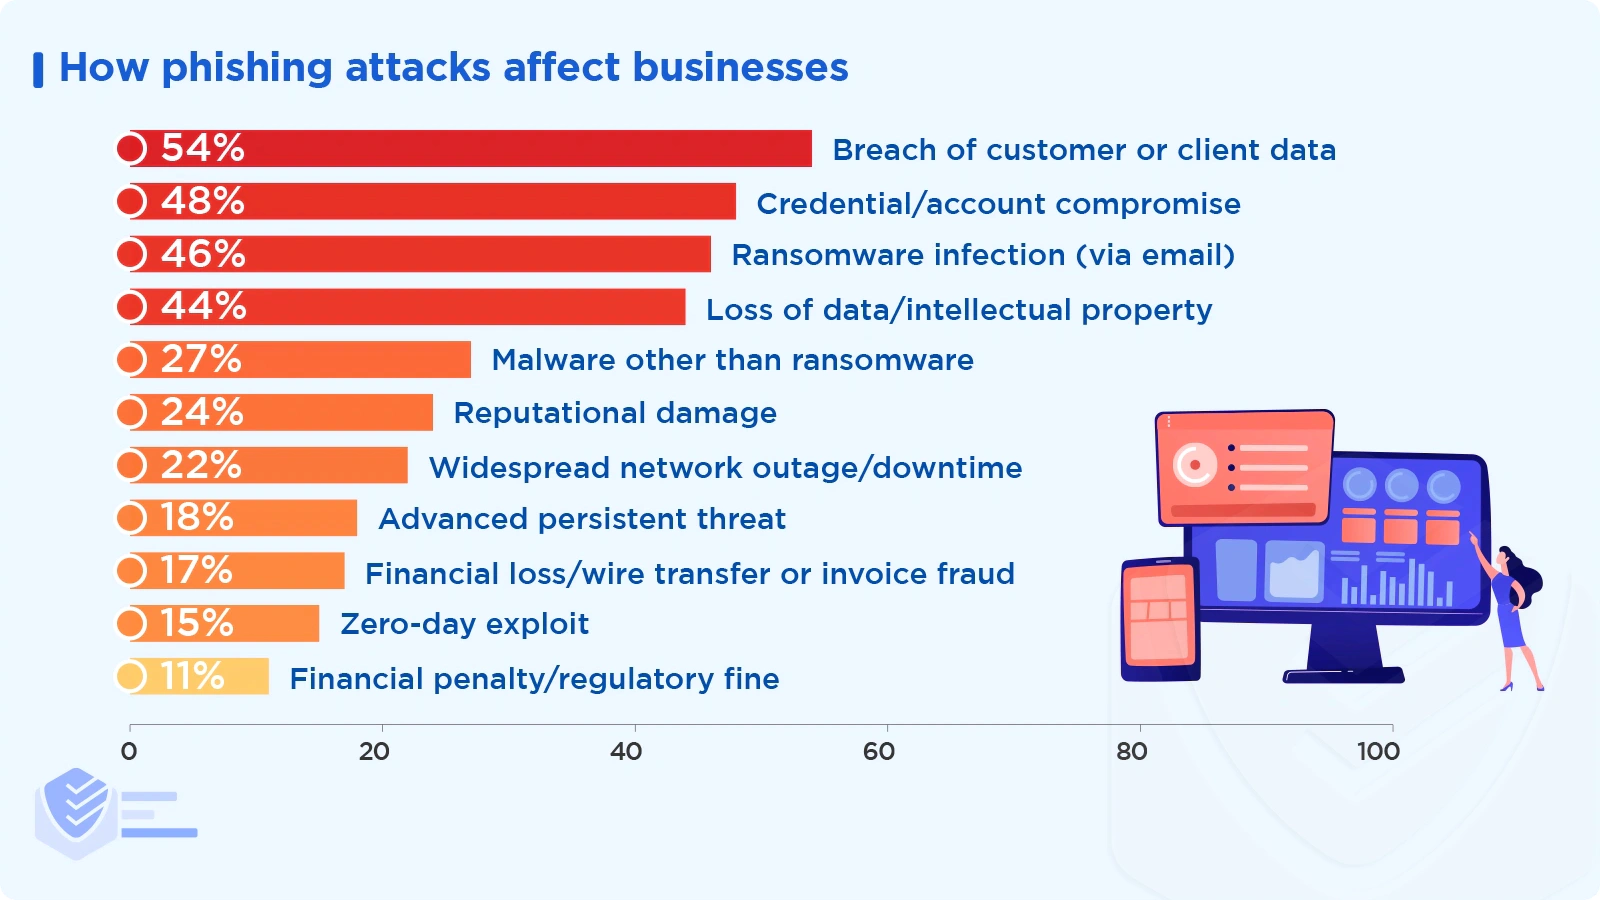
The top three results of successful phishing attacks include customer data breaches, account compromises, and ransomware infections. [Proofpoint]
Phishing attacks are considered to be the top security risk by more than 80% of IT and cybersecurity experts. [EasyDMARC]
83% of responders stated their organization suffered email-based phishing attacks in 2021, up from 57% in 2020. [Proofpoint]
54% of companies dealt with at least three successful attacks in 2021, and 11% said they had ten or more. [Proofpoint]
In comparison to 2020, there were 8% fewer reports of credential compromise, 6% fewer reports of direct financial loss, and a 2% drop in emails used to spread ransomware. [Proofpoint]
Proofpoint questioned employees about the cybersecurity incidents they had in 2021. Here are the results:
83% reported receiving at least one suspicious message.
39% of recipients received an email with a dubious attachment.
38% of people got a questionable SMS.
37% of callers or voicemails received were suspicious.
16% received a suspicious message in a business chat app.
15% of people reported receiving a fake email from their company.
42% engaged in dangerous behavior.
19% of recipients clicked a dubious website link in an email.
14% of direct message clicks resulted in malware downloads.
13% unknowingly downloaded malware from a harmful email or website.
12% of people provided personal information to a fraudster.
11% reported that they mistakenly compromised their account credentials.
37% were victims of fraud or a cyberattack.
14% of people reported that one or more of their social media accounts had been hijacked.
12% of people said someone tried to impersonate them by creating a second social media account.
Because of a scam committed against them, 12% of people lost money.
Identity theft affected 11% of people.
10% of people paid a ransom to get back access to a personal computer or their data. [Proofpoint]
As the leading cause of data breaches, credential harvesting accounted for 76% of the attacks discovered in Q1-Q2 2022. Credential theft was the first step in recent Twilio, Cisco, and Uber attacks. [SlashNext]
To remediate a user-reported phishing email, 8% of organizations took less than 10 minutes, 38% took 11-30 minutes, 41% took 31-60 minutes, 12% took 1-2 hours, and 1% took 2 or more hours.
On a scale of 1 to 5, organizations gave a 3.88 rating to their capability to prevent email-related attacks, a 3,853 rating for detecting email-related attacks, and a 3.883 rating for responding and remediating email attacks.
The most imitated brands
Most phishing attacks rely on impersonating big brands to fool their victims. Here are the latest phishing stats on this topic.
With over 31% of email spoofing incidents, Microsoft was the most imitated brand in 2021. [Zscaler]
13.6% of spoof emails in 2021 came from illegal streaming websites, primarily driven by big sporting events like the 2021 Tokyo Olympics. [Zscaler]
7.2% of phishing scams in 2021 had COVID-related themes. [Zscaler]
The monthly average number of brands targeted by phishing campaigns is 619 (Q3 21 – Q2 22). [APWG]
Services used for phishing attacks
Attackers generally use the same services that companies use. Here are the services that are used the most.
In Q2 2022, 73% of BEC attacks were launched via Gmail. In fact, Gmail hosts 24% of maliciously registered domains. [APWG]
More than 96% of phishing attacks lacked a referring domain, i.e., external websites that redirect visitors to phishing sites. [Zscaler]
Of the 4% referral domains in the total number of phishing attacks, the top 10 include:
luxherald.com
Mhtestd.gov.zw
Googlesyndication.com
Sendinblue.com
Landmarklivingston.com
Evernote.com
Google.com
Theadex.com
Natfrp.com
Adform.net [Zscaler]
To make it appear legitimate, phishing infrastructure is hosted on various popular platforms. Hosting websites account for 50.6% of phishing infrastructure, followed by Internet Service Providers (ISPs) with 39.2% and business domains with 10.2%. [Zscaler]
In Q1-Q2 2022, one-third of all threats were hosted on reputable providers like Microsoft, AWS, and Google. [SlashNext]
Many workers are unaware that hackers use legitimate services to target people. Over 30% of working adults believe that emails with recognizable logos are secure. 35% think files kept in a cloud service like Google Drive are secure. [Proofpoint]
Email-based phishing
Email is the #1 source of phishing attacks. Here are the latest email-based phishing statistics.
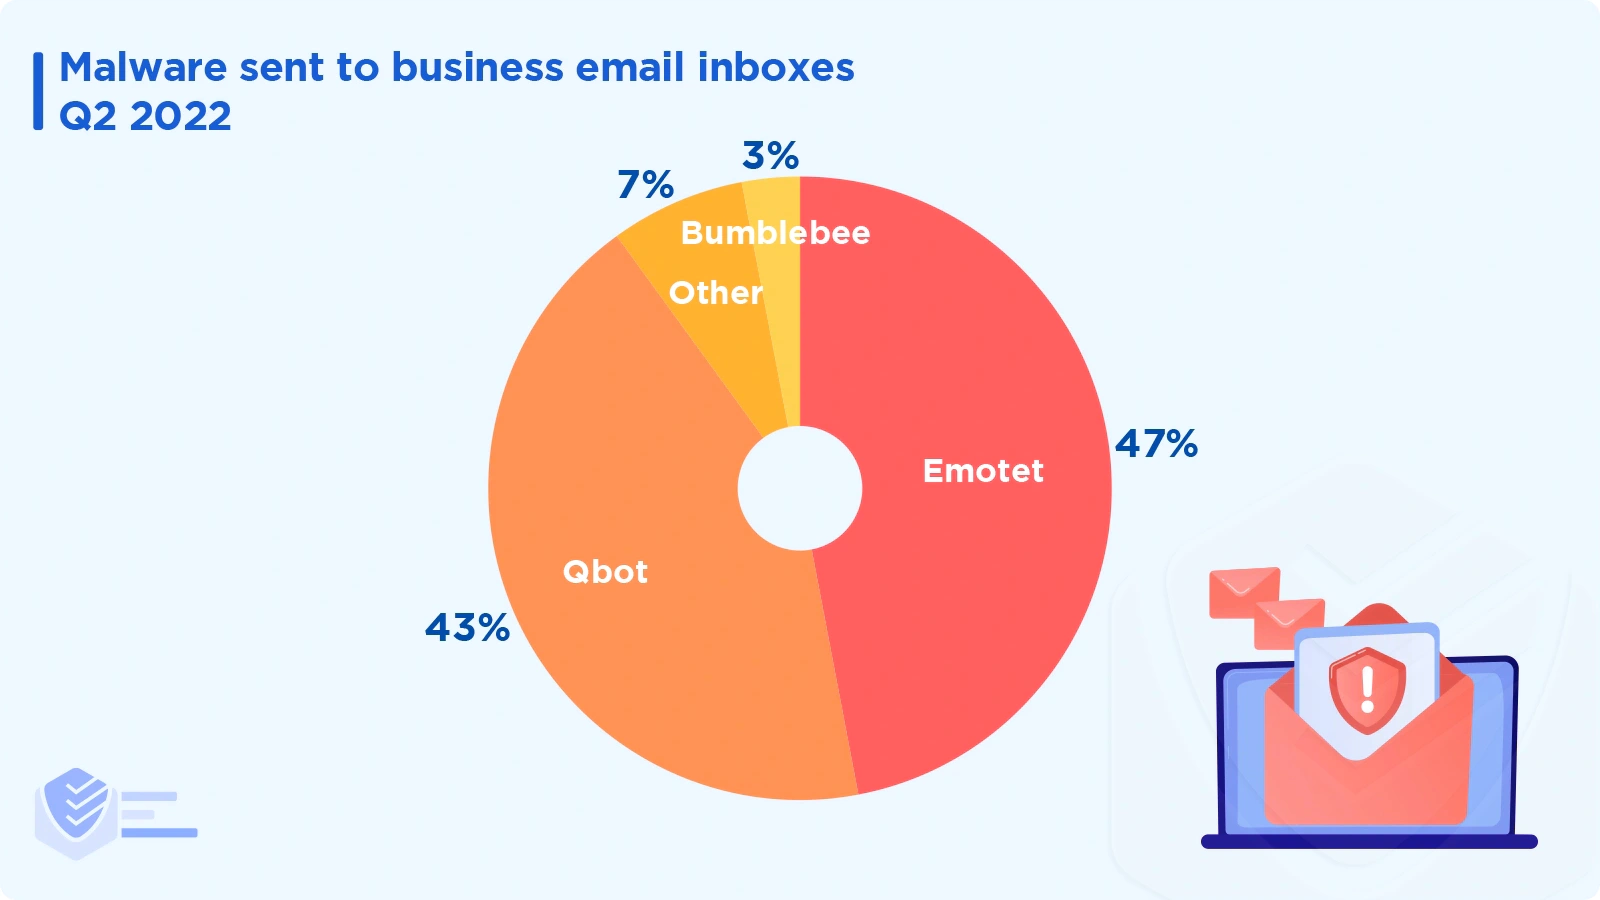
The malware families that attackers delivered the most to business email addresses include Emotet (47%), Qbot (43%), and Bumblebee (3%). [APWG]
92% of respondents said that in 2021 they had at least one email-related security incident. A staggering 72% of respondents reported having dealt with over five security incidents involving emails. [Abnormal Security]
96% of phishing attacks worldwide are sent via email, 3% are launched through malicious websites, and only 1% are conducted over the phone (smishing or vishing). [EasyDMARC]
Spear phishing emails are the starting point of 93% of successful cyberattacks worldwide. [EasyDMARC]
The average spear phishing campaign's click-through rate was 17.8%, but phishing campaigns that included phone calls were three times more successful (53.2% click rate). [IBM Security]
The types of files that were included in phishing email downloads include:
EXE — 32.79%
JS — 26.28%
MHT — 21.99%
VBS — 4.92%
DLL — 4.17%
BAT — 2.54% [Reasonlabs]
The top 5 countries from which COVID-19 phishing threats originated are Poland (20.6%), Indonesia (15.8%), the United States (9.9%), Colombia (9.0%), and Thailand (7.0%).
Phishing threats associated with COVID-19-related documents remained a concern in 2021. The majority of documents were created using Microsoft Office macros. [Reasonlabs]
In 2021, credential phishing was the most prevalent type of email-based phishing, accounting for 67% of emails (up 10% from the previous year). Credential phishing has increased due to the poor adoption of multifactor authentication in workplaces (just 22% of businesses use it). [CoFense]
Phishing campaigns that use HTML attachments have increased by 150%. These attacks make up about 30% of all credential phishing attempts. [CoFense]
The top 10 threats in emails in Q2 2022 are as follows:
HTML/Phishing.Agent trojan (21.2%) — When opening this trojan virus, a phishing website that pretends to be an official social networking, banking, or payment service website opens in the web browser.
DOC/TrojanDownloader.Agent trojan (16.9%) — This category consists of malicious Microsoft Office documents capable of downloading additional malware from the web.
Win/Exploit.CVE-2017-11882 trojan (16.7%) — A vulnerability of Microsoft Equation Editor (a Microsoft Office component).
MSIL/TrojanDownloader.Agent trojan (7.7%) — A term for malicious.NET Framework-based software created for Windows.
HTML/Phishing trojan (5.5%) — This is a collection of general malware detections made after scanning phishing emails for dangerous URLs.
HTML/Fraud trojan (2.7%) — These encompass a variety of fraudulent HTML-based content types distributed to make money or other gains.
HTML/Phishing.Outlook trojan (2.7%) — This is the name given to a type of phishing email that collects users' login details for Outlook.
LNK/TrojanDownloader.Agent trojan (2.6%) — A detection typically covering links created for malicious purposes.
VBA/TrojanDownloader.Agent trojan (2.6%) — These Microsoft Office files trick users into executing malicious macros.
MSIL/Spy.AgentTesla trojan (1.8%) — This is an info stealer threat (aka spyware) that attempts to steal user credentials or other types of data. [ESET]
The most common subject line used in phishing emails is a blank subject (79%). Following that are “Fax Delivery Report” (4.3%), “Order Confirmation” (3.2%), and "Business Proposal Request" (2.8%). [Expel]
46% of malicious emails used subject lines with references to payments, such as invoices, orders, and purchases. [ESET]
The most typical name of blocked attachments seen in Q2 2022 was "EU-BusinessRegister.pdf," which fueled a well-known subscription scam. The email invites companies to list their business for free in a fake EU register. The form requests company details. [ESET]
Microsoft Exchange Online Protection (EOP) allows 22% of malicious threats to slip through, meaning that 500,000 risky emails reach 20,000 employee inboxes daily. [SlashNext]
China has the worst percentage of emails that are spam, with 76% of all emails sent from China being spam. With 41.3%, Singapore is in second place, followed by Russia at almost 30%. [ESET]
76% of malicious emails between Q3 2020 and Q2 2021 didn’t contain an attachment. [Tessian]
On average, an employee receives 14 malicious emails each year. However, an employee in the retail sector receives 49. [Tessian]
The majority of malicious emails arrive in inboxes between 2 PM and 6 PM. This is probably because people make more mistakes in the second part of the day when they are more tired. Attackers try to exploit this. [Tessian]
45% of workers admit that they were preoccupied when they clicked on a phishing email. [Tessian]
Almost 60% of the malicious emails used generic impersonation techniques, like imitating the freemail service and using a fake display name. Over 30% used more sophisspam emailsike:
Domain Spoof — An attacker creates a fake email domain that appears to be a real one.
Direct Spoof — An email's header is changed so that the recipient's email client shows a fake email address.
Account Takeover — The attacker takes control of another person's account by hacking into it or using stolen login information to send phishing emails. [Tessian]
Between Q3 2020 and Q2 2021, 39% of organizations suffered 6 to 10 email-based incidents, 28% experienced 1 to 5 incidents, 19% had between 11 and 25 incidents, 6% had more than 25, and 8% experienced none.
Between Q3 2020 and Q2 2021, the biggest concerns to enterprises (on a scale of 1 to 5) include:
Malicious attachments (3.83)
Ransomware (3.82)
Credential phishing (3.78)
Malicious URLs (3.73)
Business email compromise (3.63)
Supply chain attack (3.59)
Spam (3.41)
Graymail (3.25) [Tessian]
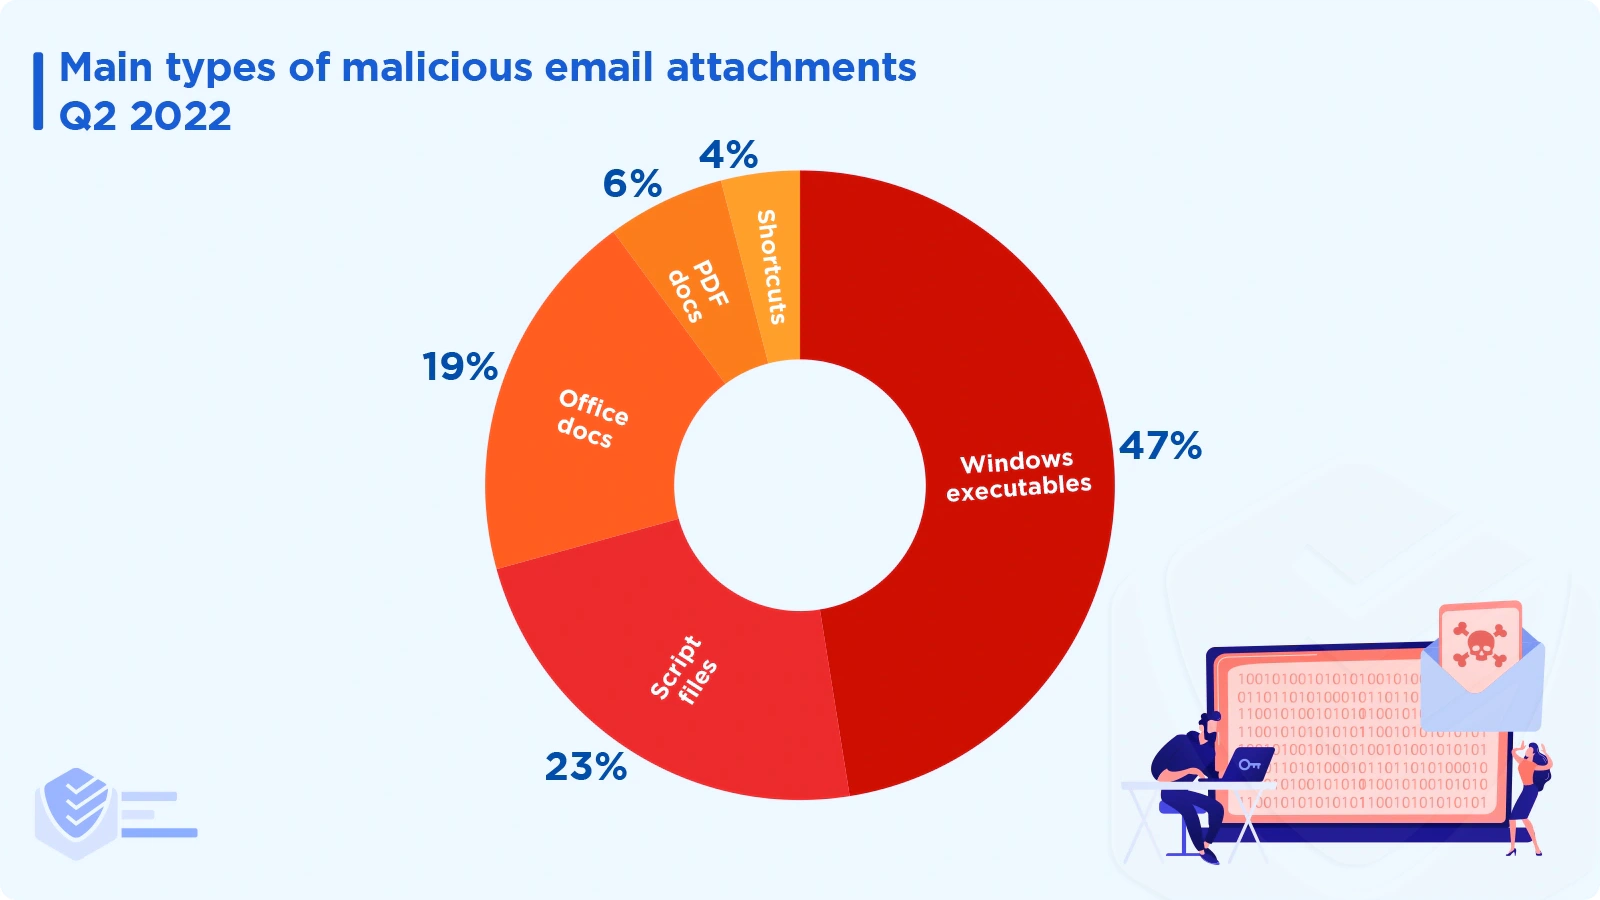
In Q2 2022, Windows executables accounted for 47% of all malicious attachments. [ESET]
Web-based phishing
Not all phishing attacks come from emails. You can land on phishing websites from other sources, such as search engines or SMS texts.
Although the number of malicious URL detections increased by 28.3% in Q2 2022, the volume of web threats that ESET blocked decreased by 6%. Also, the number of unique URLs blocked went down by 10.3%. [ESET]
ESET products blocked nearly 4.7 million unique phishing URLs in Q2 2022. That is 38,000 blocks per day. [ESET]
With over 340 million total blocks and 18 million unique blocks in Q2 2022, scam site detections saw a 4.5% decline but remained the most common web threat. [ESET]
The number of unique scam URL blocks decreased by 12.1% in the second quarter of 2022, reaching a peak of around 210,000 on July 4. [ESET]
The US continued to host the largest percentage of discovered web threats, at 34.7% in Q2 2022. Germany comes second with 7.6% of the total web threats hosted, and China comes third with 5.9%. [ESET]
Japan (12.5%), Russia (10.6%), and Peru (4.4%) were the nations that suffered the most web threat attacks in Q2 2022. [ESET]
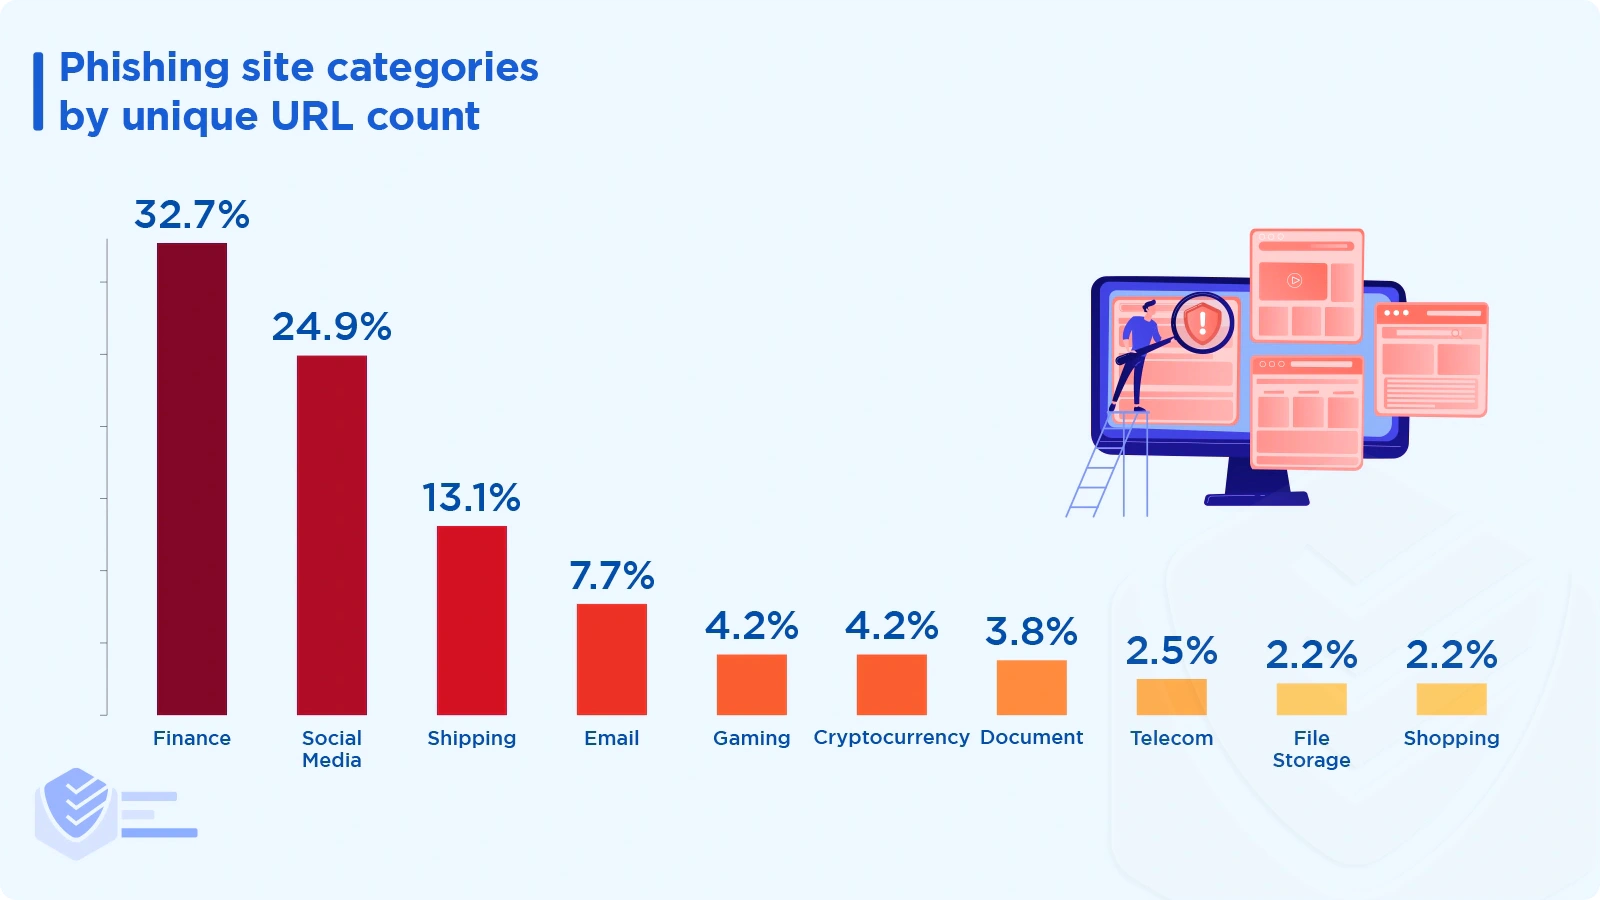
The following categories of phishing websites were the most common in Q2 2022:
Finance category (e.g., bank payments) — 32.7%
Social media (e.g., Facebook account checks) — 24.9%
Shipping (e.g., DHL and USPS requests) — 13.1%
Email — 7.7%
Gaming — 4/2%
Cryptocurrency — 4.2%
Document — 3.8%
Telecommunications — 2.5%
File storage — 2.2%
Shopping — 2.2% [ESET]
Phishing training and penetration testing
Most large organizations perform phishing training and penetration testing — sending phishing emails to employees to see how they react. Here’s what we know.
Here are the perceptions that employees throughout the world have about email and email-based attack techniques.
Email attachments can be malicious — 81%
Emails can imitate people or brands — 77%
You can't even trust familiar logos — 52%
Email providers can't block all harmful emails — 38%
Files stored in the cloud can be malicious — 37%
Unsafe contacts can send multiple emails — 37%
Internal emails can be dangerous — 36%
Their organization can't block all harmful emails — 30% [Proofpoint]
The number of campaigns mimicking credential phishing increased by 7%. [CoFense]
Worldwide, 53% of working adults responded correctly when asked what the term “phishing” was. Responses with "I'm not sure" comprised 20%, and 27% were incorrect answers. [Proofpoint]
Almost half of the businesses explicitly address email-based phishing in their training courses, and 43% do the same for ransomware. [Proofpoint]
Just 34% of employers train staff members on the best practices for email reporting. [Proofpoint]
Almost 15% of businesses fail to train employees who deal with actual or simulated phishing emails. [Proofpoint]
Nearly 75% of businesses claimed to provide their users with formal training:
43% offer computer-based instruction
38% provide in-person training
35% provide instructor-led, virtual instruction [Proofpoint]
In addition to formal instruction, alternative security training resources include:
Simulated phishing emails (41%)
Newsletters or informative emails (39%)
Awareness posters or videos (35%)
Smishing and vishing simulations (33%)
Internal cybersecurity chat channel (32%)
Competitions focused on cybersecurity (30%)
Simulated USB drops (28%)
Internal cybersecurity wiki (26%) [Proofpoint]
In 2021, 31% of organizations said they conducted phishing simulations weekly, 27% said they do simulations monthly, and 21% responded they do that daily. [Proofpoint]
Between 2016 and 2021, reports of phishing simulation emails increased by 10%. [Verizon]
In 2021, employees reported 15% of suspicious phishing emails they didn't click on and 9% of phishing emails they opened. [Verizon]
Untrained employees fail to pass a phishing test in 32.4% of cases. In the 90 days following their initial KnowBe4 training, 17.6% of users who had been trained failed. Furthermore, just 5% of users failed a phishing test after at least a year of using the phishing prevention platform. [KnowBe4]
The consequence model
Here are the stats regarding the consequences of falling prey to phishing attacks.
In 2020 and 2021, 55% of organizations punished employees who fell prey to real or simulated phishing attacks. [Proofpoint]
According to 24% of organizations, a consequence model is not the best fit for their organization's culture. [Proofpoint]
70% of businesses that use a consequence model reported an increase in employee knowledge of phishing.
25% of respondents said that awareness has remained unchanged, and 4% claimed that awareness has fallen since the introduction of consequences. [Proofpoint]
The three most prevalent consequences of interacting with real or simulated phishing attacks include a discussion with the manager (60%), a discussion with the infosec team (59%), and an impact on performance reviews (52%). [Proofpoint]
Email security trends
Email security technology constantly evolves, and companies must adapt to stay ahead of cybercriminals.
Secure email gateways (SEGs), according to 78% of businesses, are largely ineffective at defending modern cloud email environments. [Abnormal Security]
90% of survey respondents concur that the complete functionality of an SEG can be replaced by a cloud email provider's native security features combined with an Integrated Cloud Email Security (ICES) platform. [Abnormal Security]
93% of companies already use or intend to use cloud email services like Google Workspace or Microsoft 365. [Extreme Security]
Almost 63% of those surveyed claim to be using native features of their cloud email service. 59.3% responded they still use traditional SEG, and 50% stated they use an Integrated Cloud Email Security (ICES) solution. [Abnormal Security]
DMARC implementation
The DMARC (Domain-based Message Authentication, Reporting, and Conformance) protocol enhances and tracks a domain's defense against fraudulent email. Implementing it is increasingly essential for a company’s security.
From 2020 to 2021, DMARC adoption increased by 19% worldwide. However, only 10% of Fortune 500 companies implemented DMARC policies at their strictest level of enforcement. [Agari]
Nearly 4.8 million domains worldwide (37%) are at the highest level of DMARC enforcement as of 2021 [Agari] — 1 million more compared to 2020.
66% of Fortune 500 companies risk being implicated in scams that aim to defraud their customers, business partners, investors, and members of the public. [Agari]
In 2021, there was a 41% rise in the proportion of domains in the US with DMARC policies set to the strictest level of enforcement. That’s the most of any country. [Agari]
By the end of 2021, 18,913 organizations adopted BIMI, up 96% from just 9,628 at the beginning of 2020. BIMI is an email specification that enables organizations to control the logo they display in their emails, preventing brand spoofing. [Agari]
Sources
2021 INTERNET CRIME REPORT — FBI
X-Force Threat Intelligence Index 2022 — IBM Security
2021 Data Breach Annual Report — Identity Theft Resource Center
2022 Annual State of Phishing Report — CoFense
2022 State of the Phish — Proofpoint
Data Breach Investigations Report — Verizon
PHISHING ACTIVITY TRENDS REPORT — Anti-Phishing Working Group (APWG)
2022 Phishing by Industry Benchmarking Report — KnowBe4
THREAT REPORT T2 2022 — ESET
2022 ThreatLabz Phishing Report — Zscaler
Quarterly Threat Report – Q2 2022 — Expel
Phishing Statistics Report (January to June 2022) — EasyDMARC
The State of Consumer Cybersecurity 2022 — Reasonlabs
Phishers’ Favorites 2021 Year-in-Review — Vade
The State of Phishing 2022 — SlashNext
Spear Phishing Report 2021 — Tessian
Email Fraud & Identity Deception Trends Report — Agari
2022 Email Security Trends Report — Abnormal Security
Octav Fedor (Cybersecurity Editor)
Octav is a cybersecurity researcher and writer at AntivirusGuide. When he’s not publishing his honest opinions about security software online, he likes to learn about programming, watch astronomy documentaries, and participate in general knowledge competitions.